Spotify Dashboard
تفاصيل العمل
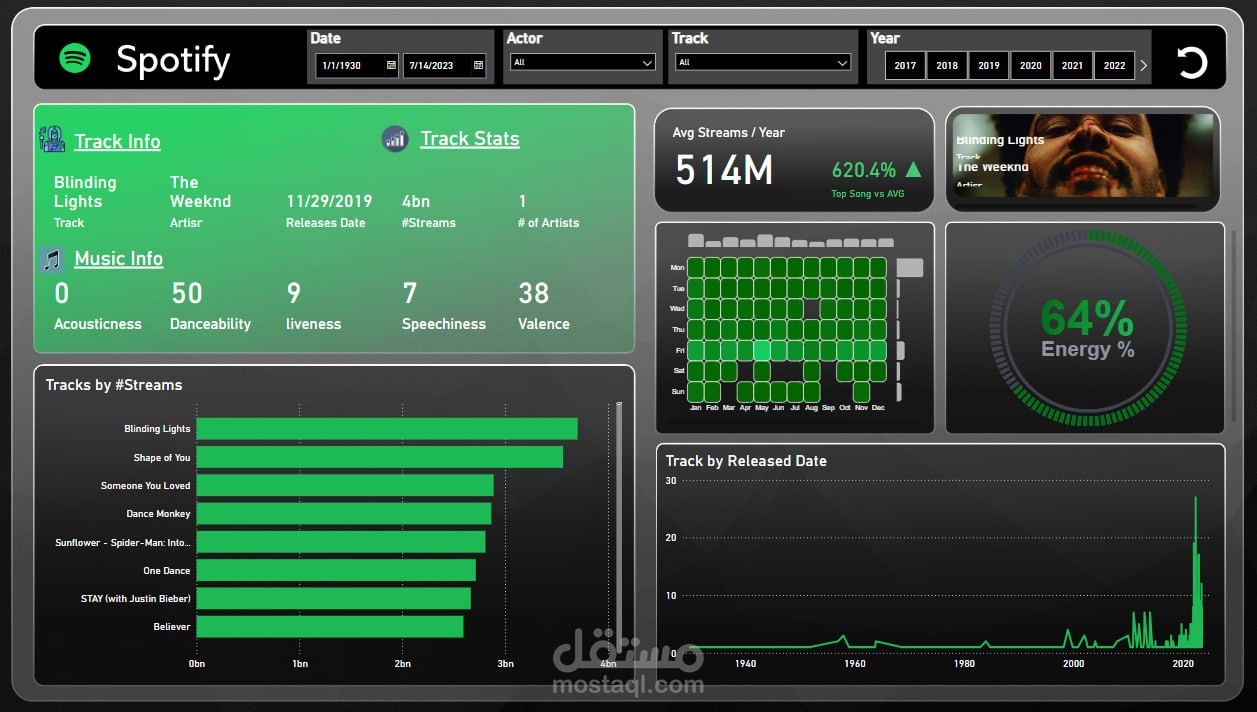
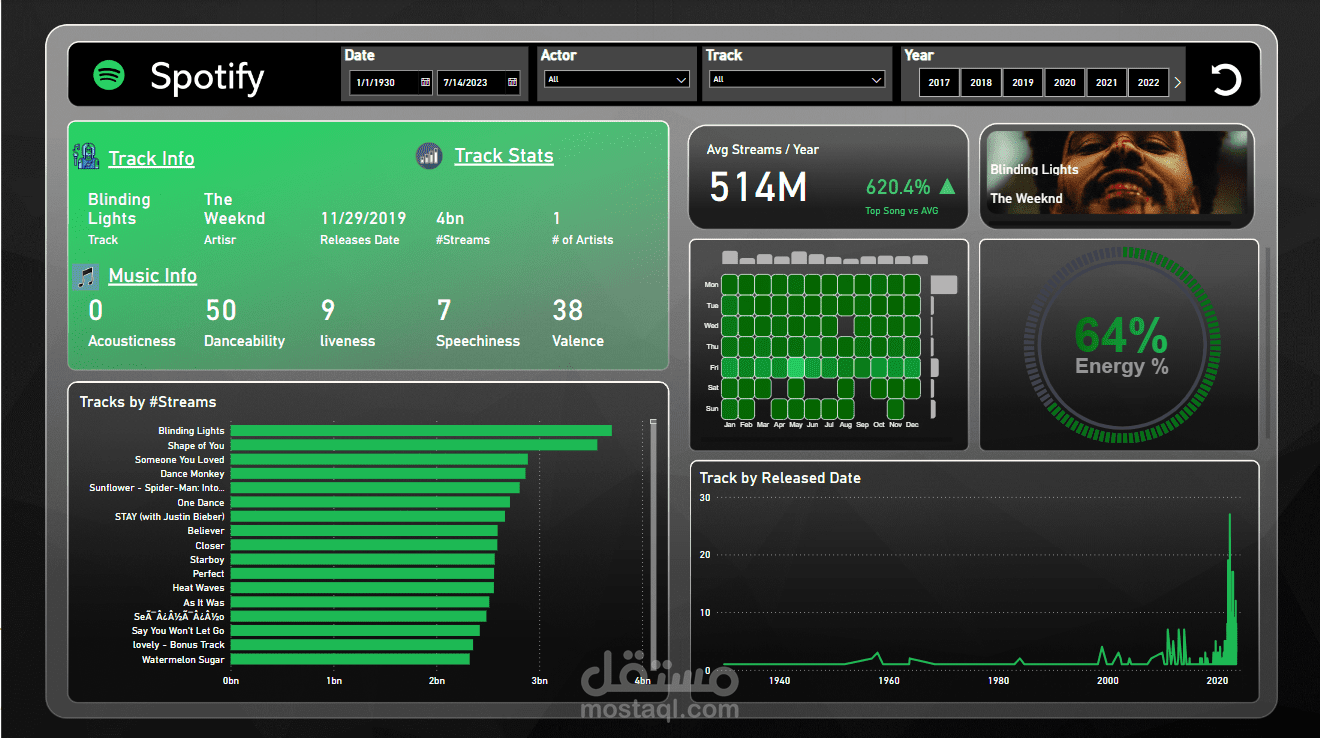
🎵 Spotify Music Streaming Analytics Dashboard | لوحة تحليل بث الموسيقى
لوحة بتصميم داكن على طراز Spotify، تستكشف بيانات بث الأغاني وخصائصها الصوتية بشكل تفاعلي وجذّاب.
━━━━━━━━━━━━━━━━━━
🎯 الهدف | Purpose
Explore track performance and audio features to understand what makes songs popular.
📊 أهم المؤشرات | Key Metrics
▶️ Average Streams / Year: 514M
🎚️ Audio features: danceability, energy (64%), valence, speechiness, liveness, acousticness
🏆 Top tracks by streams (Blinding Lights, Shape of You…)
🗂️ التفاصيل | Highlights
📅 Calendar heatmap of streams
📈 Release-date histogram
🎼 Track info & audio-feature gauges
🛠️ التفاعل | Interactivity
▫️ Filters: date / artist / track / year
▫️ Bookmarks for guided views
▫️ Interactive gauges
💡 أهم الاستنتاجات | Key Takeaways
✅ Audio-feature view links sound profile to streaming success
✅ Calendar heatmap reveals seasonal streaming patterns
✅ Top-tracks ranking surfaces the biggest hits at a glance
🧰 الأدوات | Tools & Techniques
Power BI • DAX • Custom dark theme • Calendar heatmap • Gauge visuals • Bookmarks & filters