Performance Power BI report for Plant Company
تفاصيل العمل
*Project Goals:*
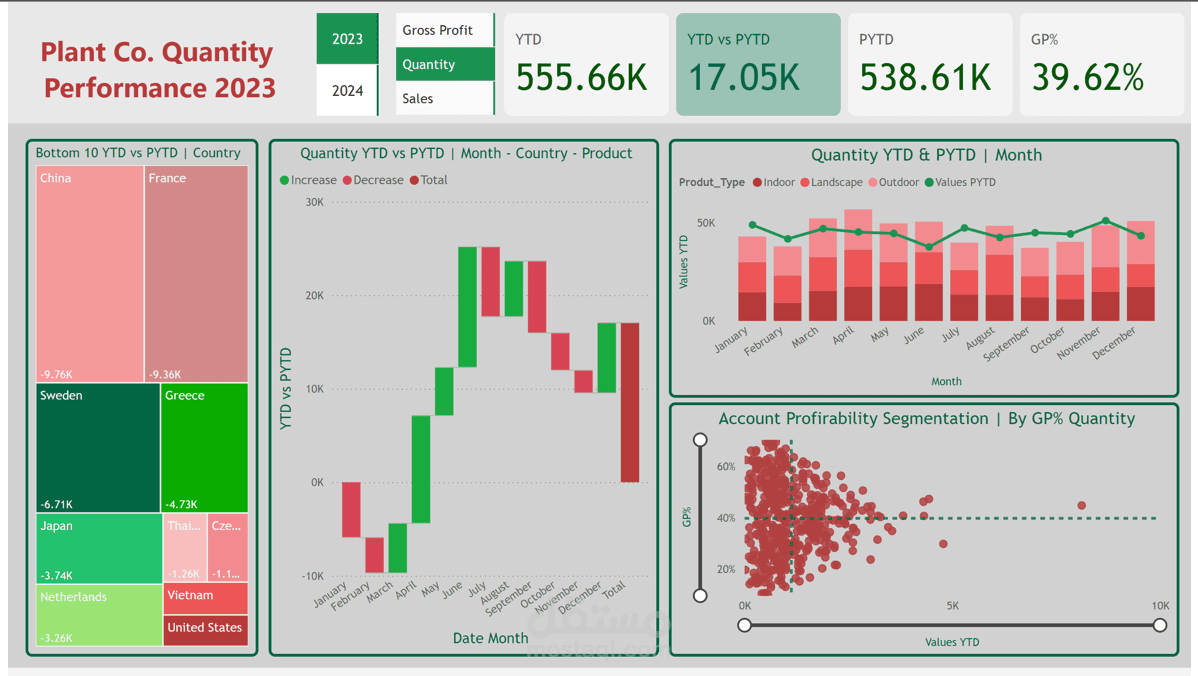
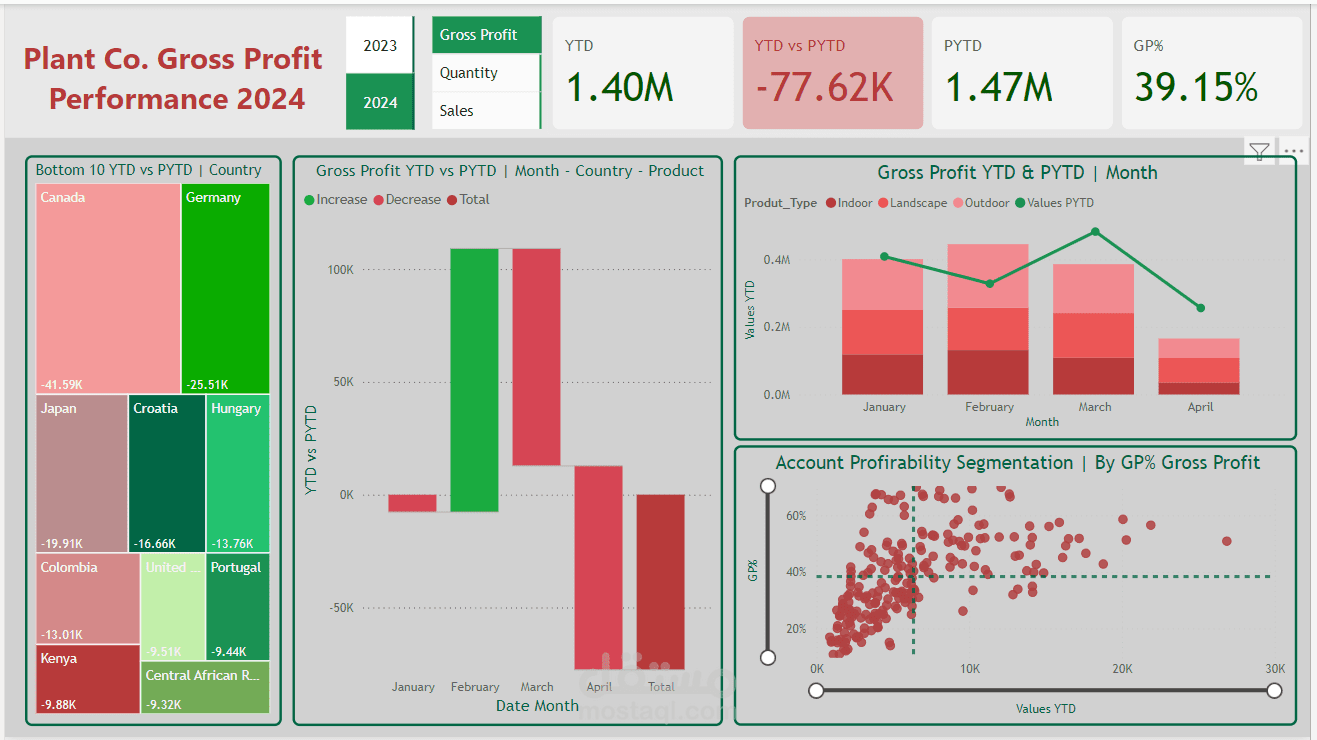
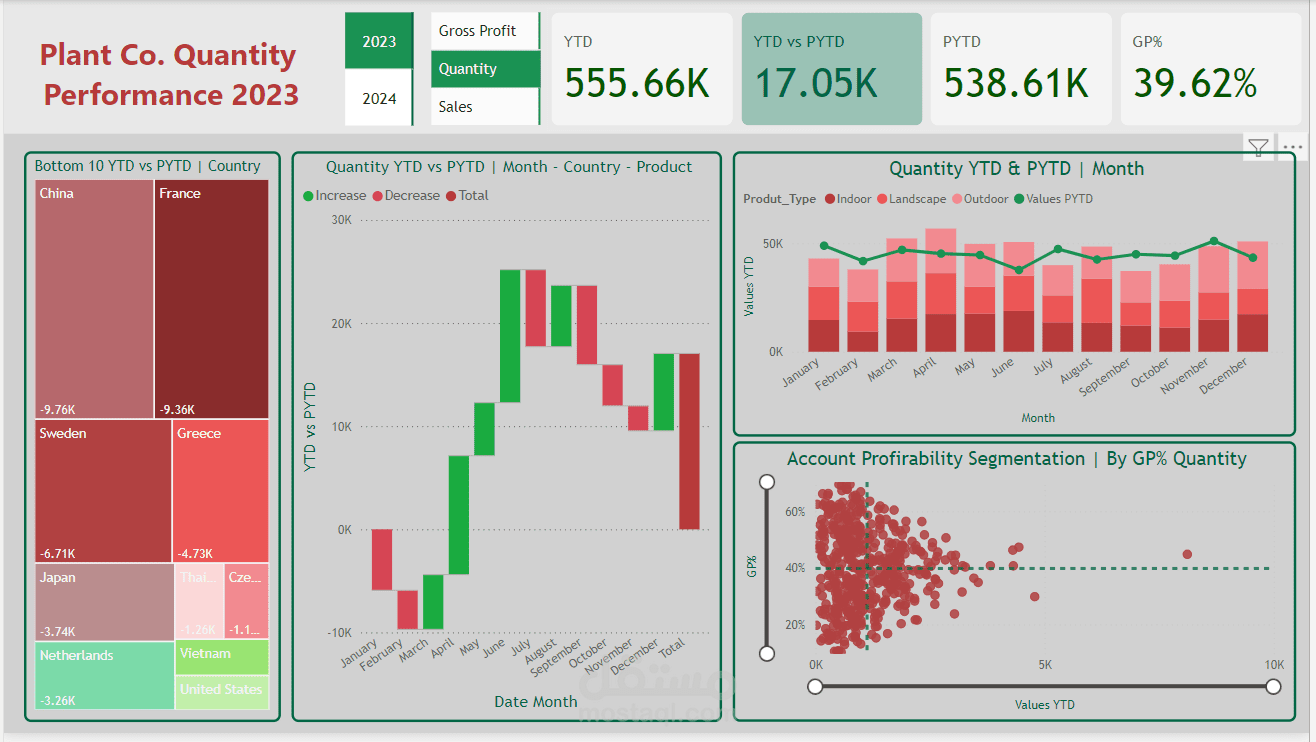
Develop a dynamic dashboard to analyze plant sales data, providing critical insights for strategic decision-making and performance tracking.
*Key Performance Indicators (KPIs):*
- Sales This Year vs. Last Year (Month-on-Month)
- Sales This Year vs. Last Year by Country
- Sales This Year vs. Last Year by Product Type (Indoor, Outdoor, etc.)
- Gross Profit Percentage (GP%)
- Year-to-Date (YTD) vs. Prior Year-to-Date (PYTD) Sales & Total Sales
- YTD vs. PYTD Quantity & Total Quantity
- YTD vs. PYTD Gross Profit & Total Gross Profit
- Relationship Between GP% by Sales and Values in YTD (Scatter Plot)
*Power Query Editor:*
- *Data Cleaning:* Removed duplicates, standardized data formats, and ensured data integrity.
- *Data Transformation:* Applied necessary transformations to align with the project's analytical needs.
*Approach:*
*Data Integration & Transformation:*
- Unified multiple data sources, ensuring consistency and accuracy across all datasets.
*Data Modeling & Relationships:*
- Developed a robust data model with well-defined relationships to support multi-dimensional analysis.
*Interactive Dashboards:*
- Created visually engaging and user-friendly dashboards that allow stakeholders to easily compare current and past performance metrics across different dimensions such as time, geography, and product type.
*Key Insights Extraction:*
- Defined and extracted KPIs that reflect sales performance, profitability, and growth trends.
*Dynamic Analysis:*
- Enabled dynamic filtering and comparison of metrics like sales, quantity, and gross profit, both YTD and PYTD, with a focus on differences and trends.
*DAX Functions Used:*
- *YTD & PYTD Measures:* Calculated YTD and PYTD values for sales, quantity, and gross profit.
- *Difference Calculations:* Computed differences between YTD and PYTD metrics to assess growth or decline.
- *Base Measures:* Calculated total quantity, total sales, total gross profit, and GP%.
- *Dynamic Titles:* Used DAX to generate dynamic titles that reflect the selected filters and data context.
*Conclusion:*
This project highlights my expertise in leveraging Power BI to deliver detailed and actionable insights into plant sales performance. The dashboard provides a comprehensive view of sales dynamics, profitability, and growth trends, empowering stakeholders to make data-driven decisions and optimize business strategies.