Global Terrorism Analysis Using Python
تفاصيل العمل

ello Guys !
I recently completed a data engineering project focusing on global wealth data using PostgreSQL and Python. Here’s how I approached it:
Data Collection and Preparation: Used datasets (Wealth-AccountsCountry.csv, Wealth-AccountData.csv, Wealth-AccountSeries.csv) to gather information on countries, wealth indicators, and series topics.
Database Setup: Established a PostgreSQL database (accounts) and created tables (accountscountry, accountsdata, accountsseries) to store country details, wealth indicators over years, and series metadata.
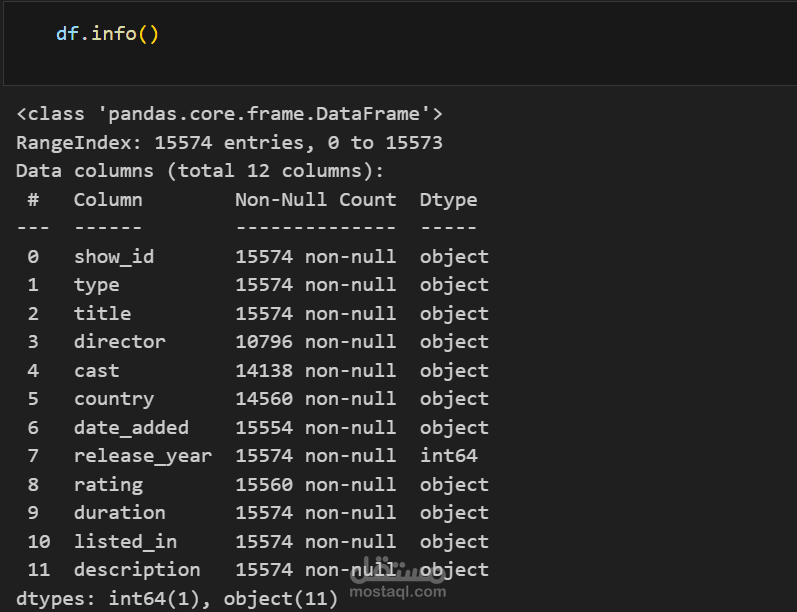
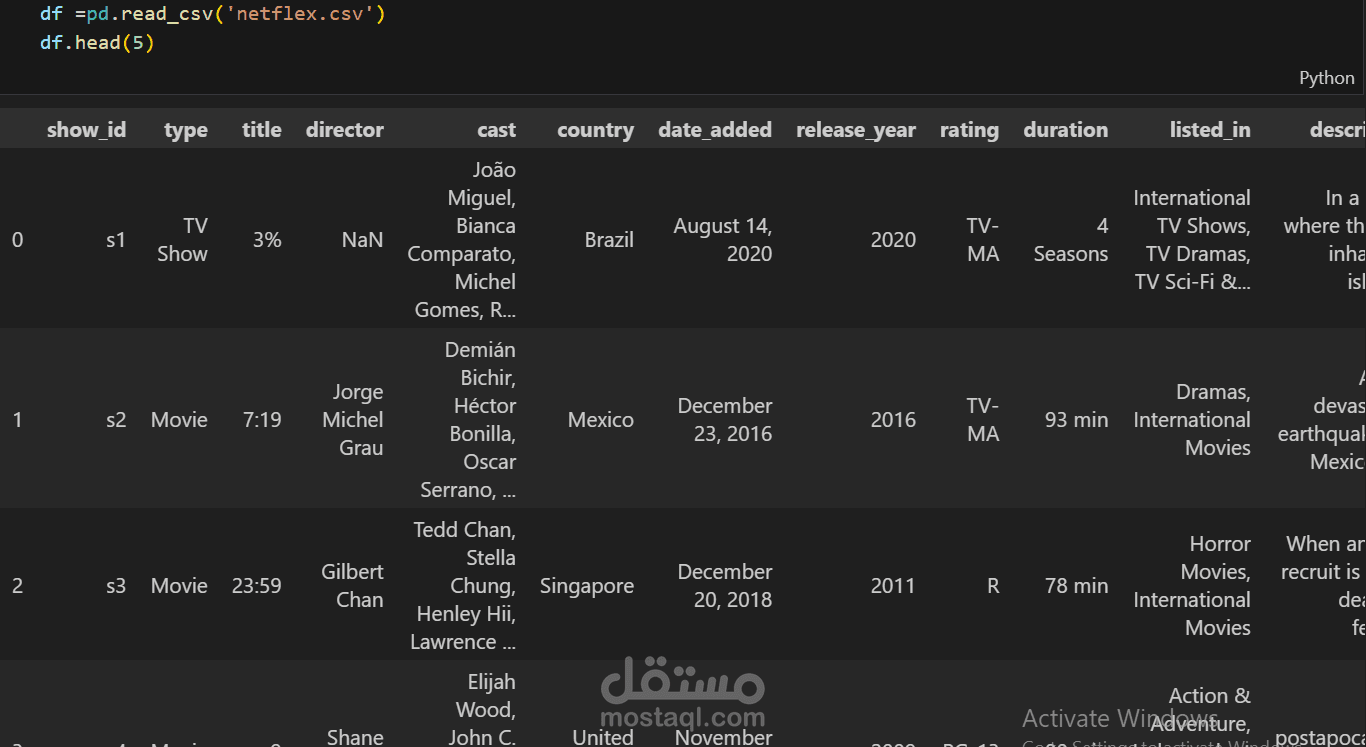
Data Loading and Transformation: Imported CSV data into Pandas DataFrames for initial exploration, renamed columns, selected relevant features, and formatted data for PostgreSQL compatibility.
Database Operations: Connected Python to PostgreSQL using psycopg2, executed SQL commands to create tables, define relationships (FOREIGN KEY constraints), and inserted cleaned data.
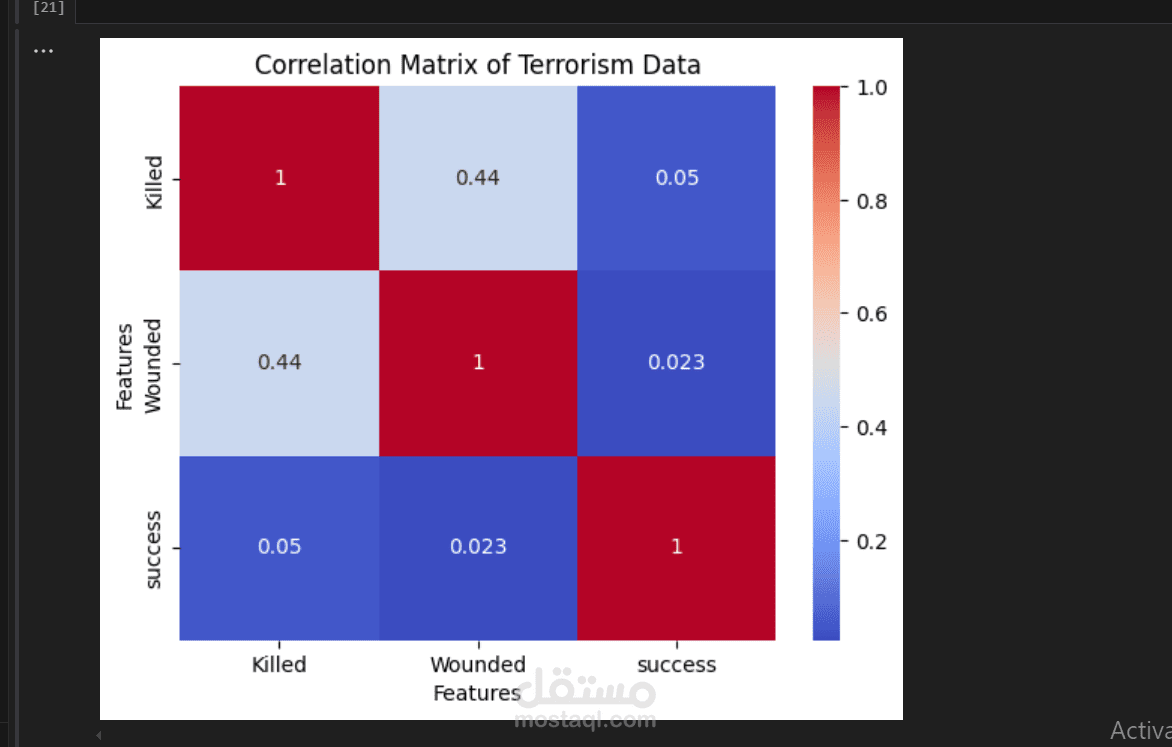
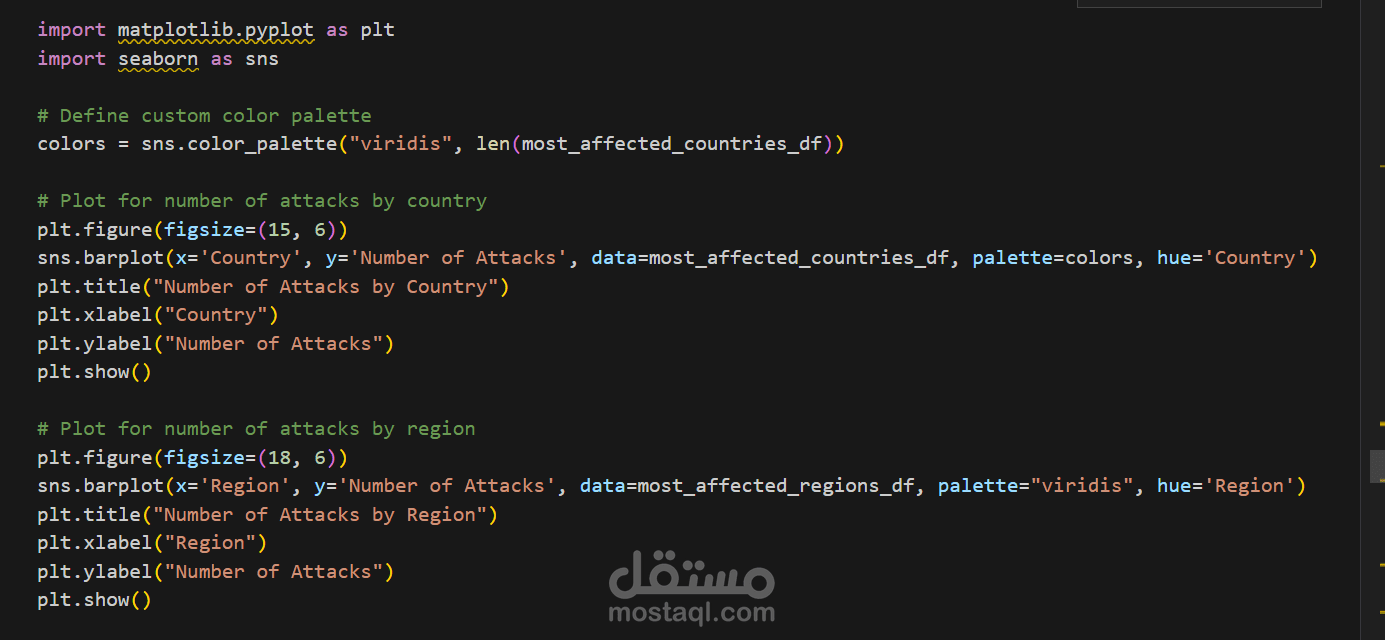
Exploratory Data Analysis (EDA): Utilized Pandas, Matplotlib, and Seaborn for EDA, examining country distributions (Short Name, Currency Unit) and analyzing indicators by topic and series codes.
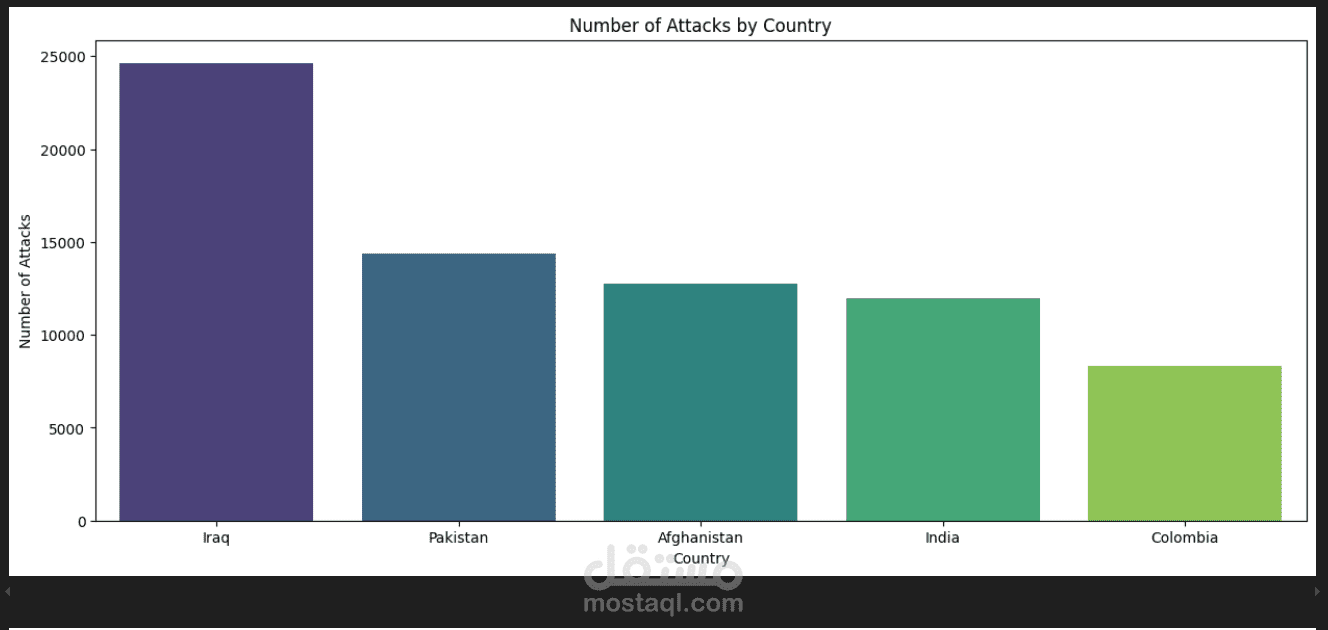
Visualization and Insights: Presented insights through bar plots and pie charts, highlighting top countries by metrics (Short Name), currency unit distributions, and indicator counts by topic and series codes.
===========================================
link Github : https://lnkd.in/dFiswtWn
hashtag#DataEngineering hashtag#SQL hashtag#Python hashtag#PostgreSQL hashtag#DataAnalysis hashtag#DataVisualization