Flights Delay Using power bi
تفاصيل العمل
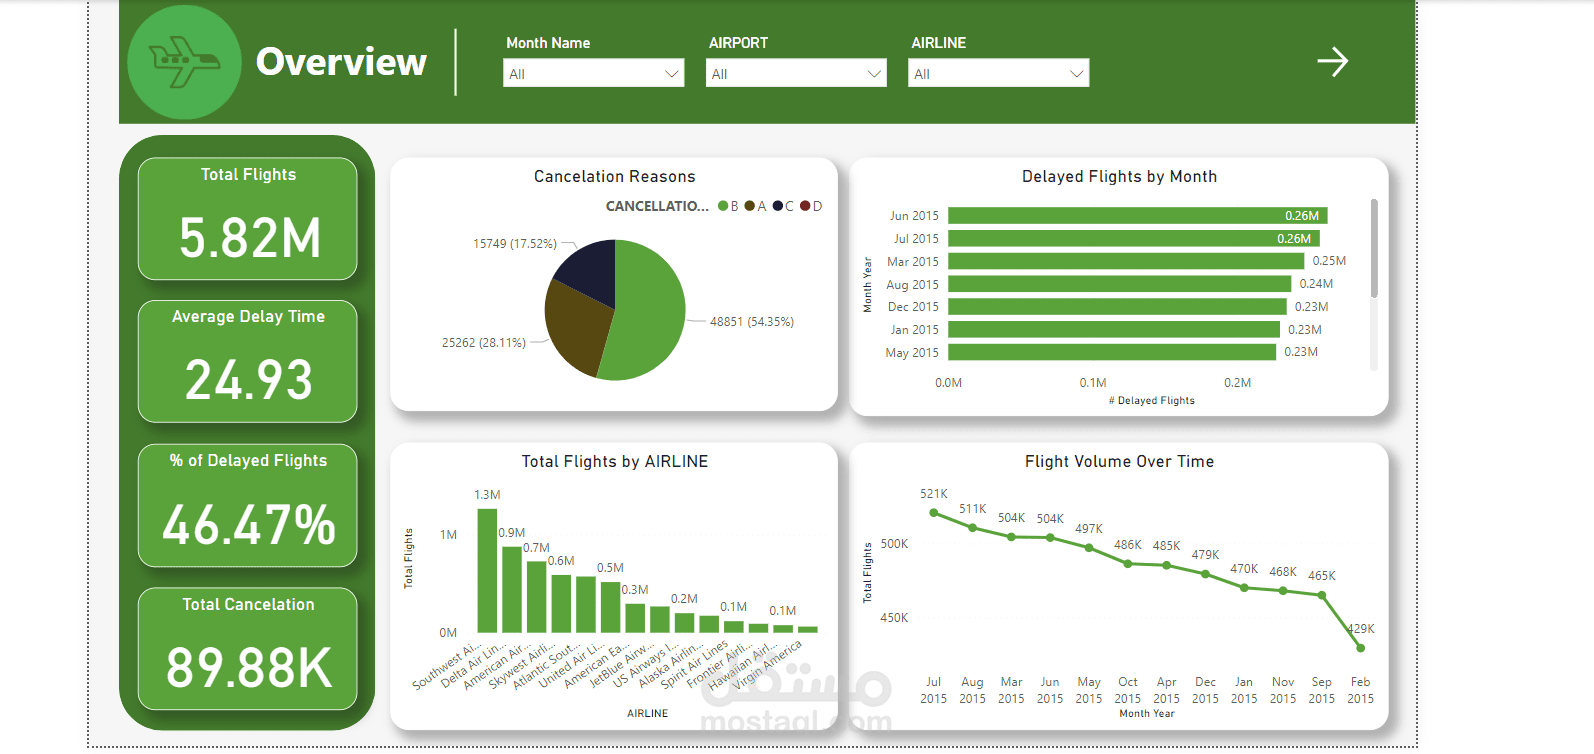

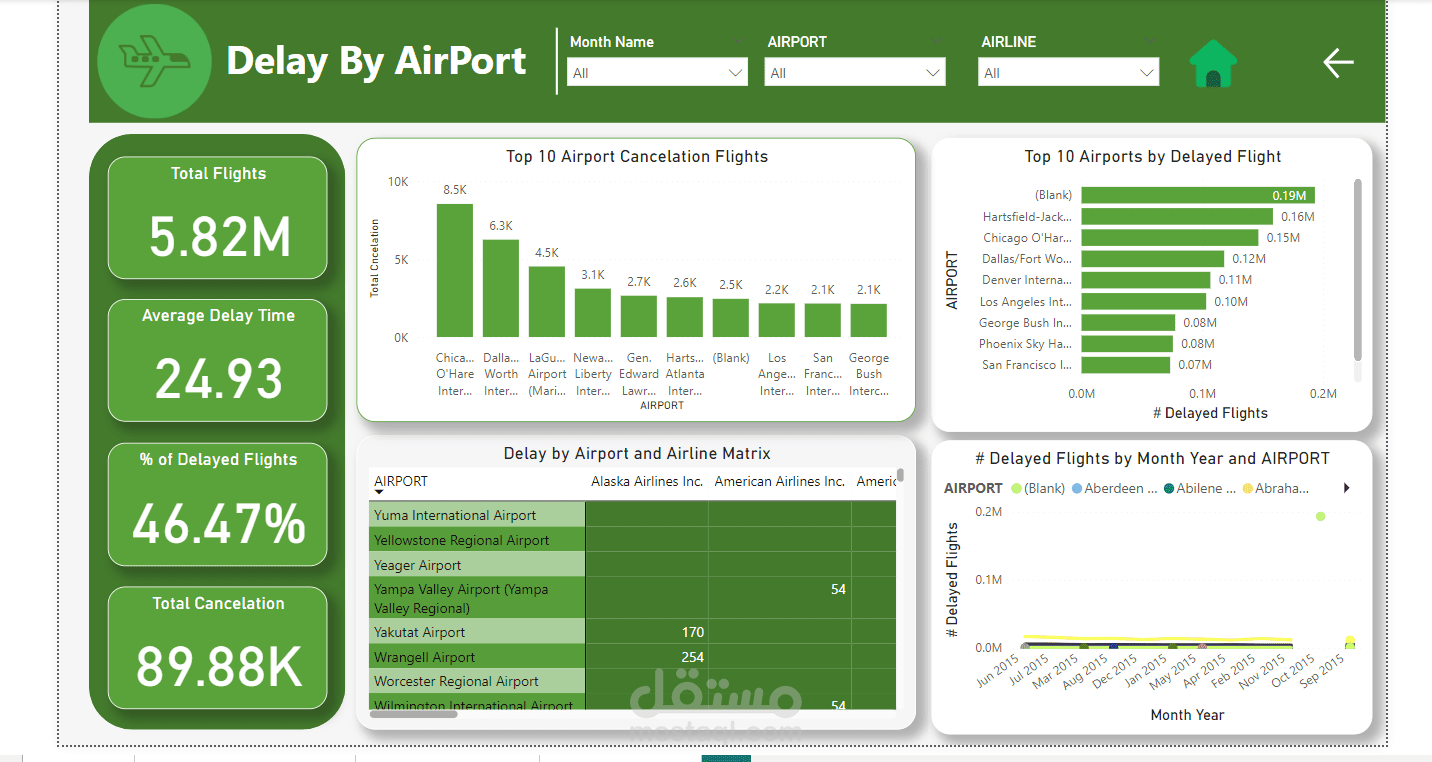
تحليل أكثر من 5 ملايين سجل رحلات لعام 2015، مع التركيز على مؤشرات رئيسية مثل حجم الرحلات، التأخيرات، والإلغاءات.
التحليل الرئيسي:
تحليل حجم الرحلات:
الهدف: تحديد كيفية تباين أحجام الرحلات حسب الشهر واليوم من الأسبوع.
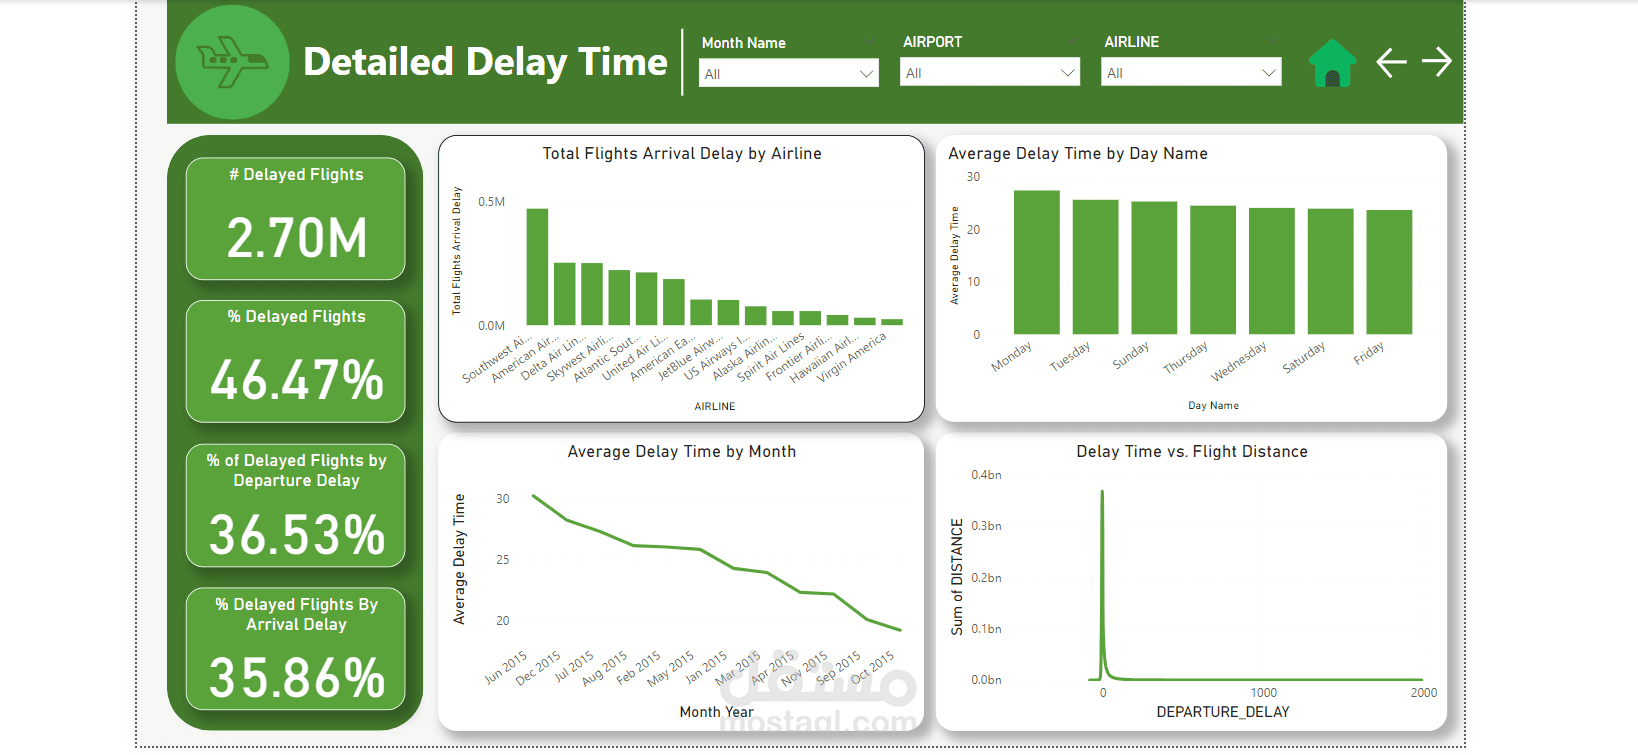
تحليل تأخيرات المغادرة:
الهدف: حساب نسبة الرحلات التي تعرضت لتأخير في المغادرة ومتوسط مدة التأخير بالدقائق.
اتجاهات التأخير حسب السنة والموقع:
الهدف: تحليل كيفية تغير نسبة الرحلات المتأخرة خلال العام، مع التركيز بشكل خاص على الرحلات التي تغادر من بوسطن (BOS).
تحليل الإلغاء:
الهدف: حساب عدد إلغاءات الرحلات وتحديد النسبة التي كانت بسبب الطقس مقابل المشاكل المتعلقة بشركات الطيران.
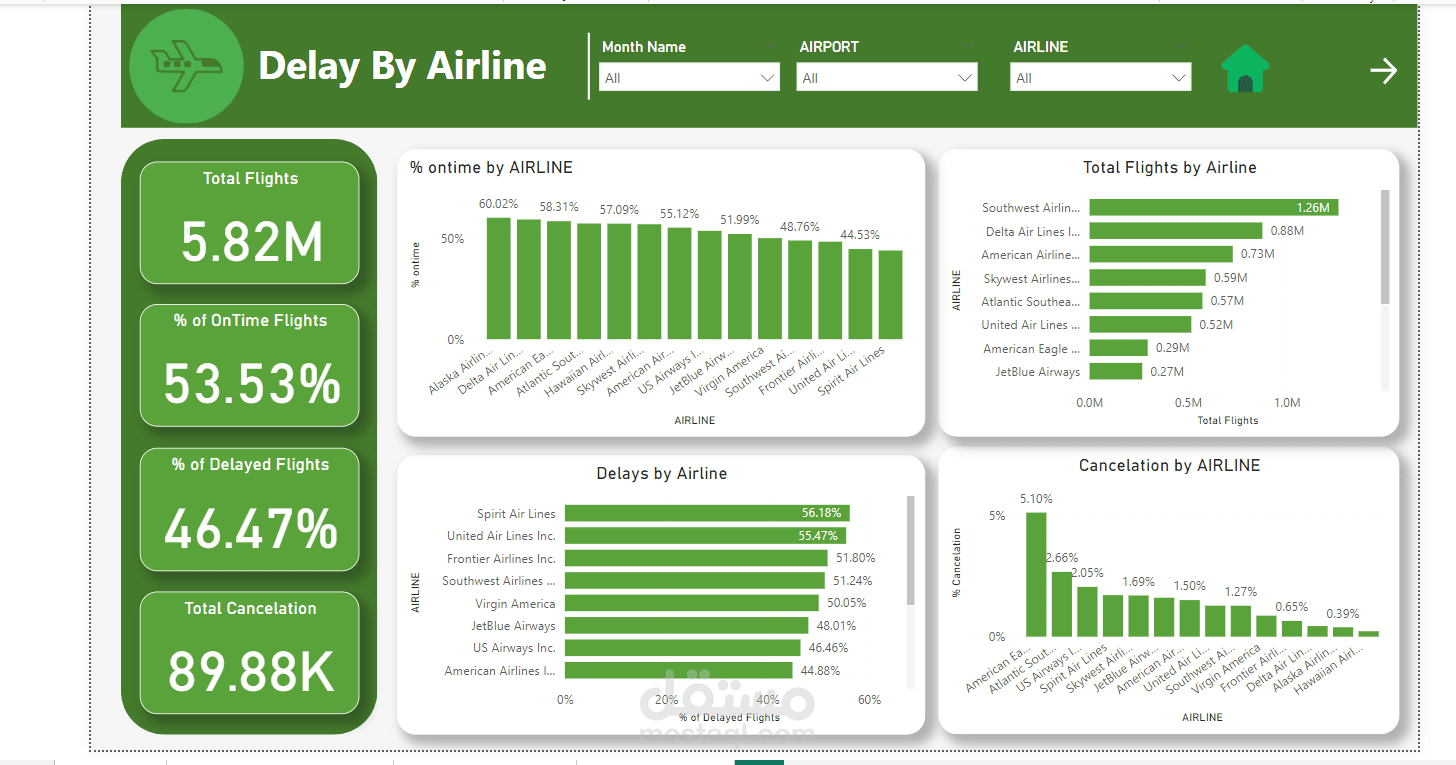
موثوقية شركات الطيران:
الهدف: تحديد أكثر وأقل شركات الطيران موثوقية من حيث دقة مواعيد المغادرة.
المنهجية:
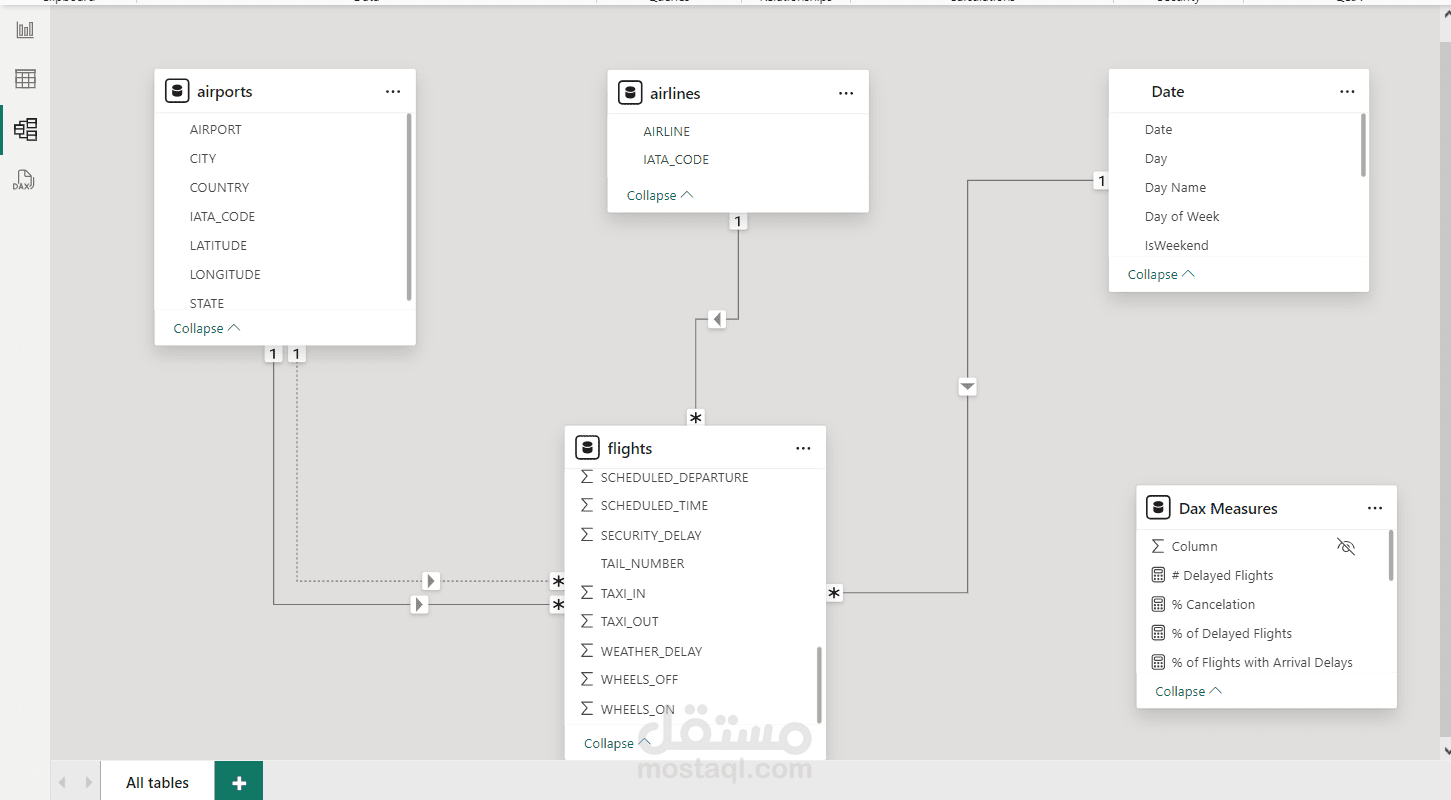
البيانات: تم تحليل 5.82 مليون سجل موزعة على 40 حقلاً.
العملية: من عمليات الاستخراج، التحويل والتحميل (ETL) إلى التصور باستخدام البيانات المأخوذة من Kaggle.
الأدوات: تم استخدام Power BI لنمذجة البيانات، التحليل وإنشاء لوحات تحكم تفاعلية وديناميكية.
النتائج:
أدى هذا المشروع إلى فهم أعمق لتباين أحجام الرحلات، أنماط التأخير، وأسباب الإلغاءات، مما يوفر رؤى قابلة للتنفيذ لتحسين عمليات شركات الطيران.
النتائج:
أربع صفحات تفاعلية في Power BI:
لوحة التحكم الملخصة: نظرة عامة على أحجام الرحلات، التأخيرات، والإلغاءات.
التأخير حسب شركة الطيران: مقارنة الأداء الزمني بين شركات الطيران.
تحليل مدة التأخير بالتفصيل: تحليل متعمق لمدة التأخير.
التأخير حسب المطار: تحليل التأخير الخاص بالمطارات، مع تسليط الضوء على الأداء في المحاور الرئيسية.
الخطوات التالية:
يساهم هذا التحليل في تحسين كفاءة العمليات ويمكّن أصحاب المصلحة من اتخاذ قرارات مستندة إلى البيانات. التقرير مصمم ليكون قابلاً للتحديث لضمان توفير رؤى محدثة مع إضافة بيانات جديدة.
مصدر البيانات: Kaggle - تقرير النقل الجوي لوزارة النقل الأمريكية.