Sales Dashboards Using Tableau
تفاصيل العمل
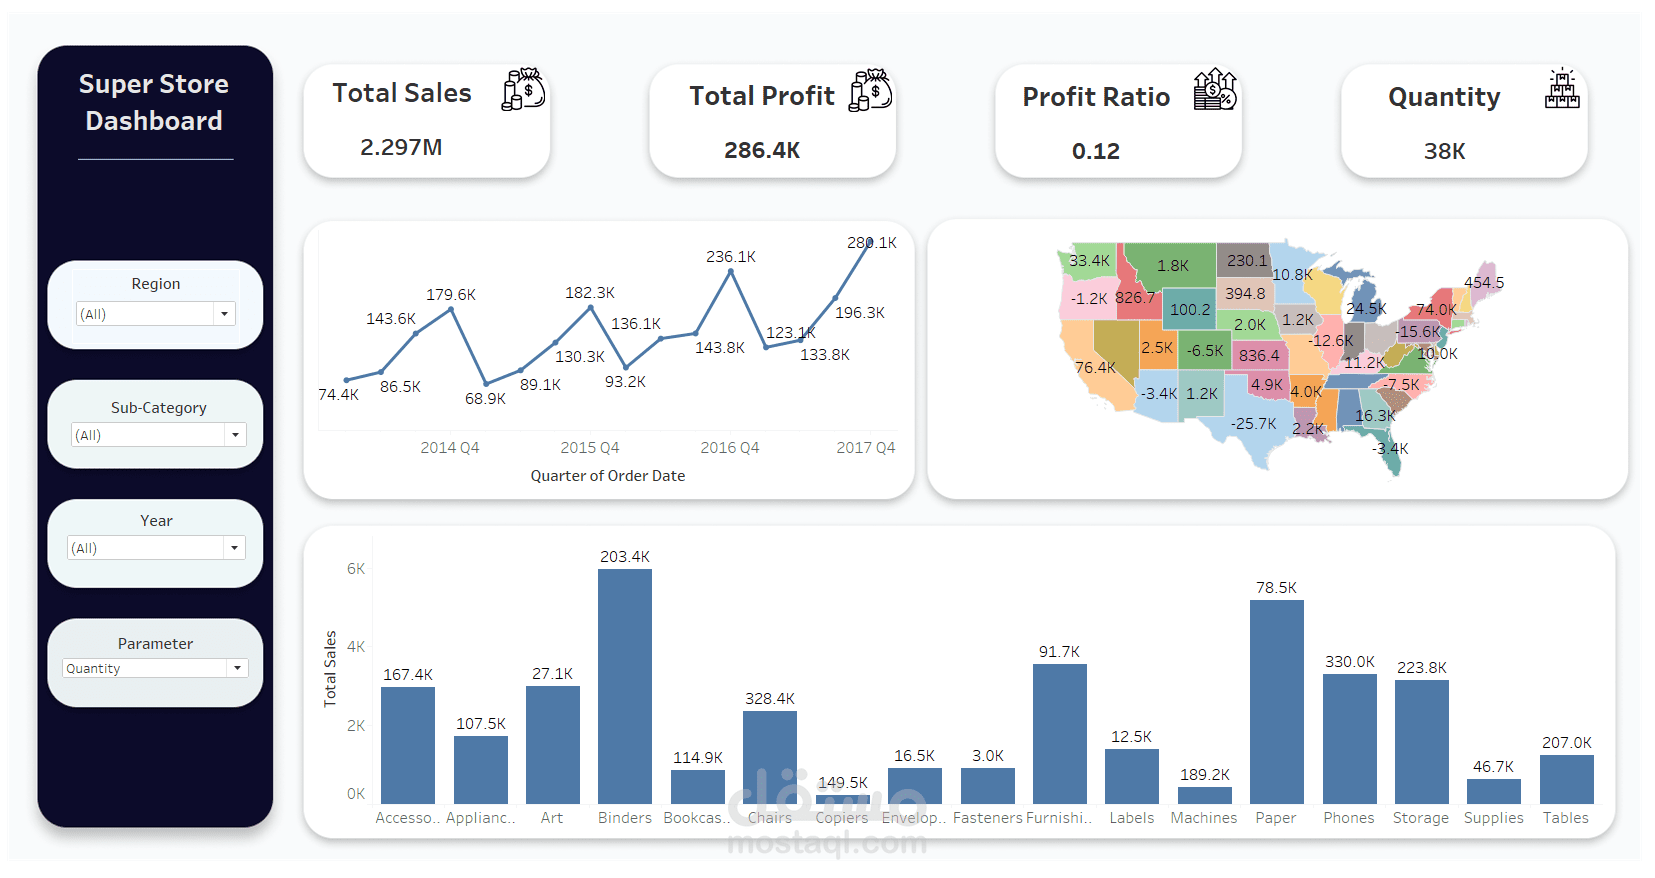

اللوحة الرئيسية: تعرض المقاييس الرئيسية مثل إجمالي الربح، المبيعات، الكمية، نسبة الربح، وبيانات العملاء. كما تحتوي على رسوم بيانية للمبيعات والربح لكل ولاية، والمبيعات لكل ربع سنة، بالإضافة إلى المبيعات والربح والكمية لكل فئة فرعية.
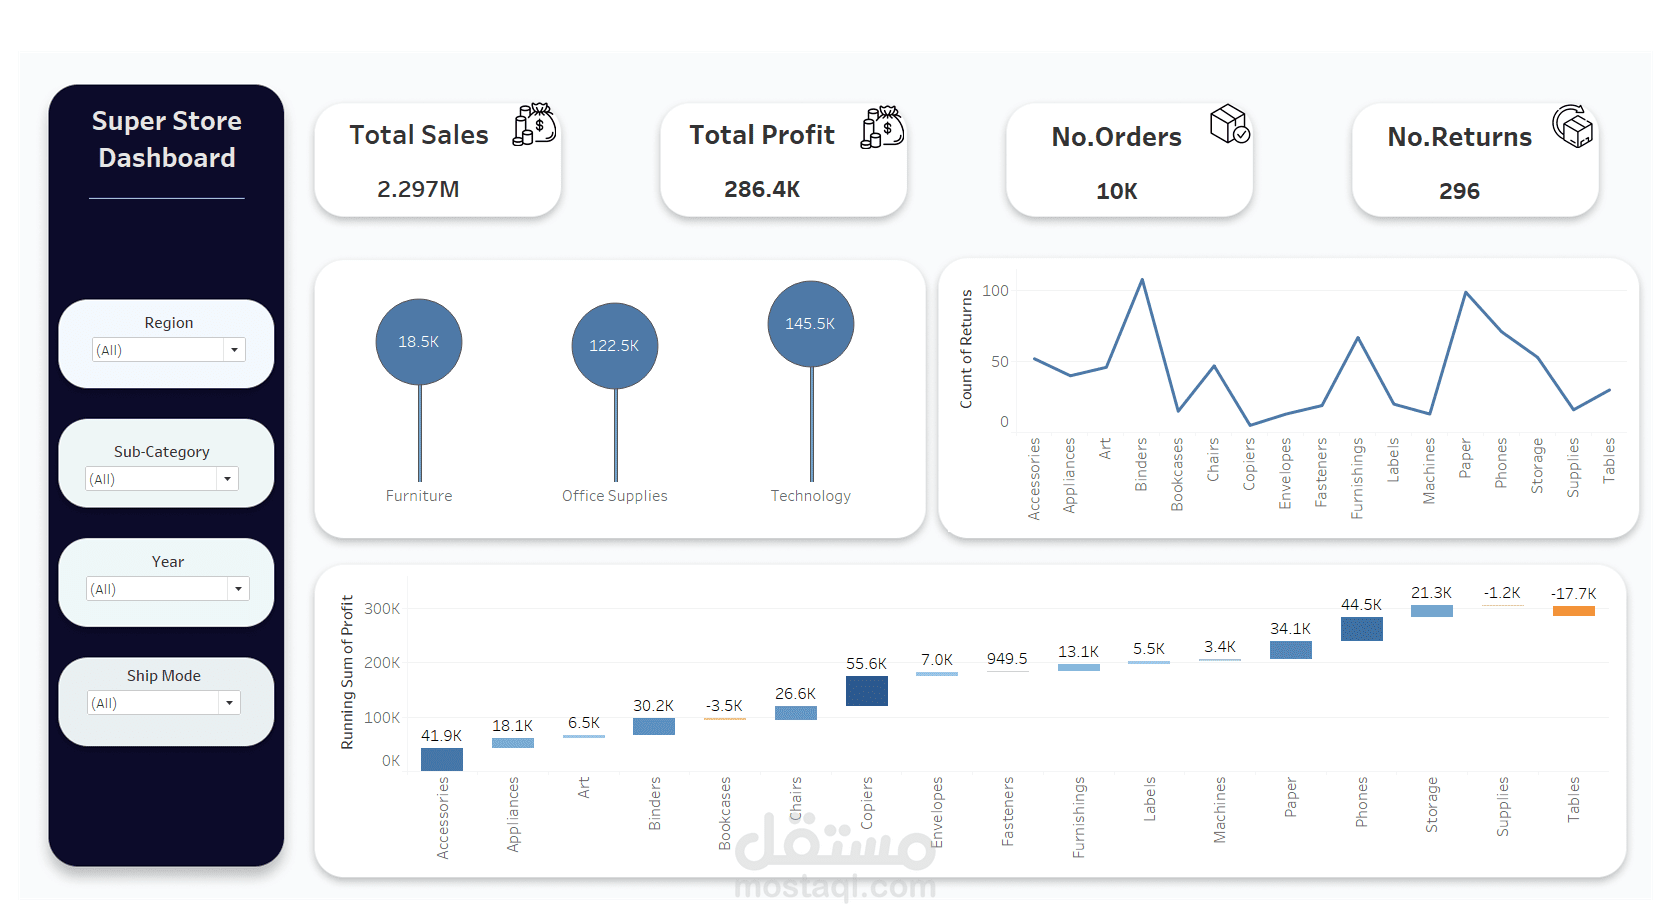
لوحة النظرة العامة: تحتوي على مخطط شلالي للربح، ومبيعات إجمالية لكل فئة باستخدام مخطط "اللولي بوب" (مع إمكانيات التصفية)، وعدد الإرجاعات لكل فئة فرعية.
كل لوحة تم تصميمها لتسهيل الوصول إلى رؤى عميقة واتخاذ قرارات مستنيرة بناءً على البيانات.
أنا متحمس للفرص التي يفتحها هذا المشروع للتحليل القائم على البيانات، وأود سماع آرائكم وملاحظاتكم!