AdventureWorks Sales Analysis OLTP - Power BI - SQL
تفاصيل العمل

Overview
This project involves analyzing the AdventureWorks OLTP database to gain insights into sales performance. The analysis includes creating views, building fact and dimension tables, and visualizing various sales metrics.
Data Source
AdventureWorks OLTP database
Tools Used
SQL Server for data extraction and transformation
Power BI for data visualization and analysis
All Process
Data Collection: Gathered sales data from AdventureWorks database.
Data Extraction : Retrieved data from essential tables, views and function.
Date Table Creation: Implemented an M language script to generate a comprehensive date dimension table for enhanced time-based analysis.
Data Transformation: Cleaned and prepared the dataset by renaming tables and columns and removing unused data.
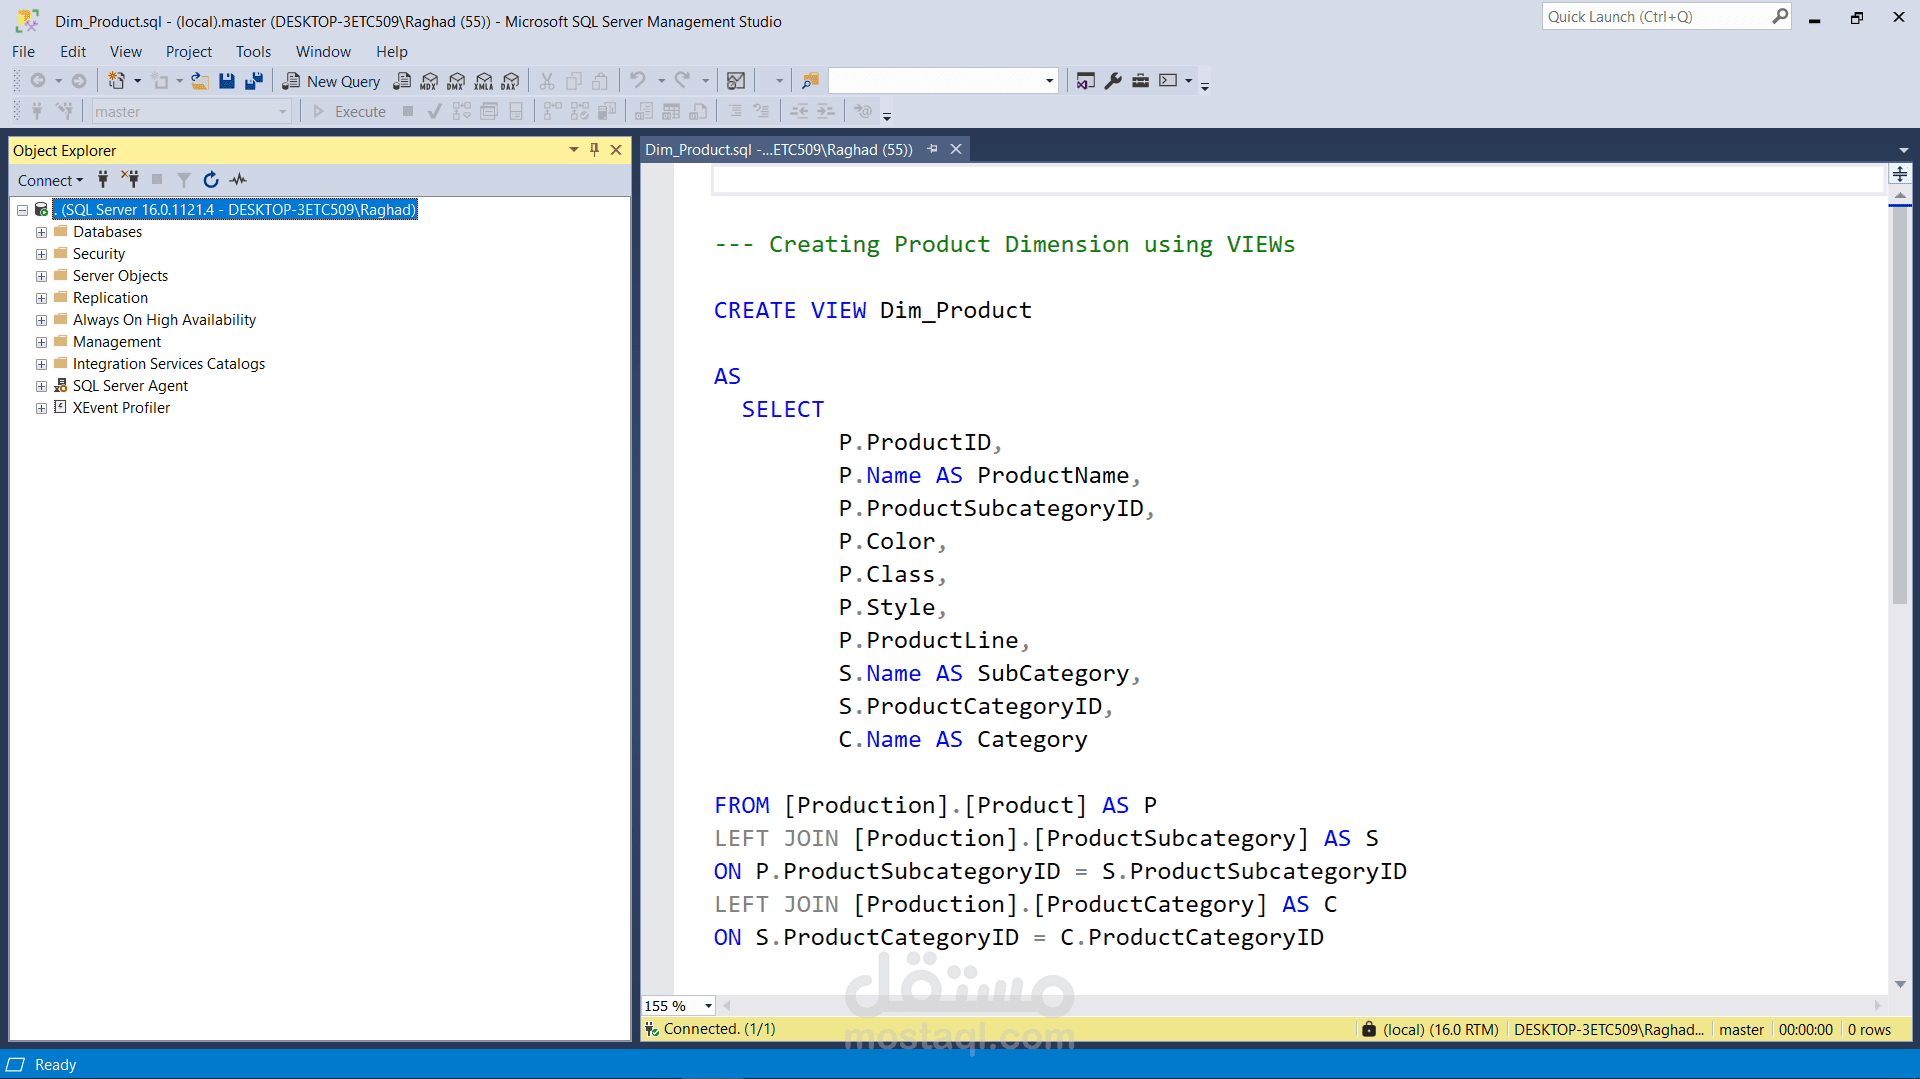
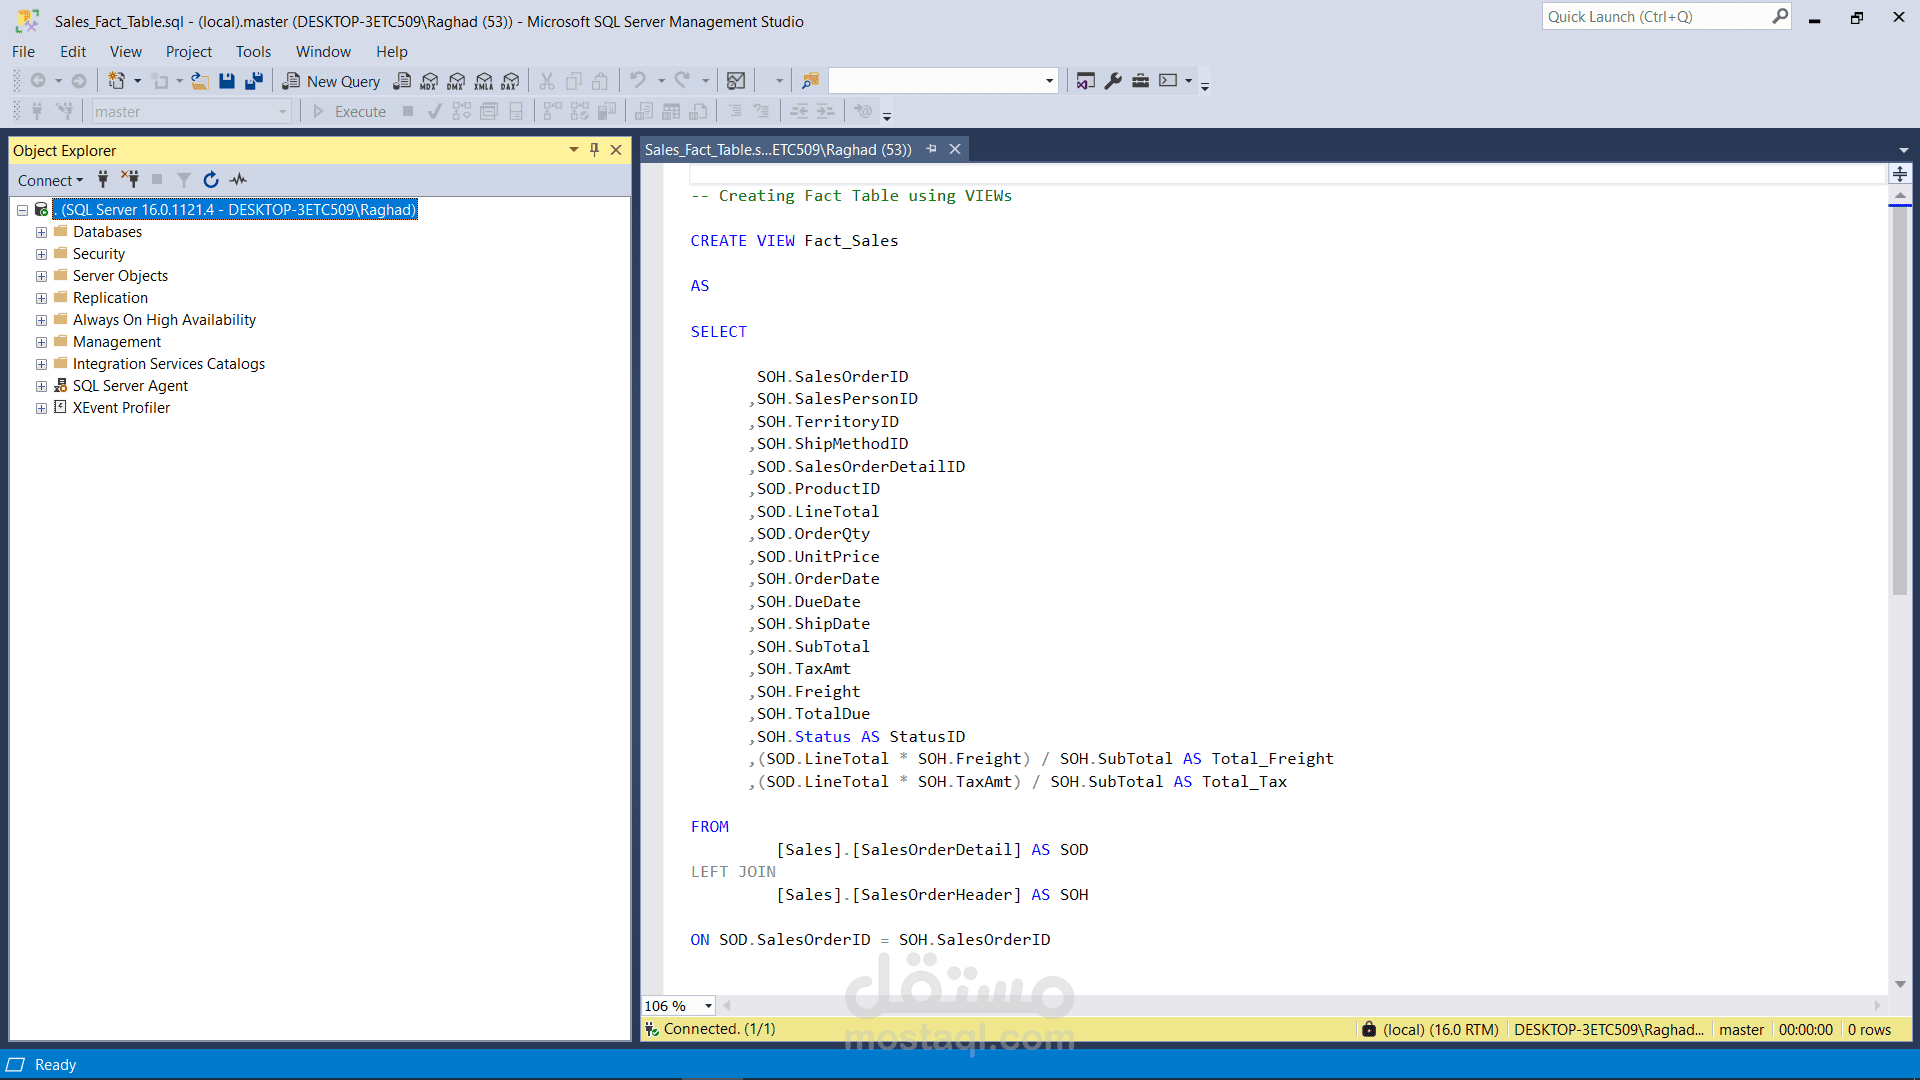
Data Modeling: Structured data into a star schema for efficient querying and analysis.
Measures: Created a set of critical measures for analysis, including the use of USERELATIONSHIP function to manage Inactive Relationships in a Role-Playing Dimension.
Data Analysis: Performed descriptive statistics and trend analysis.
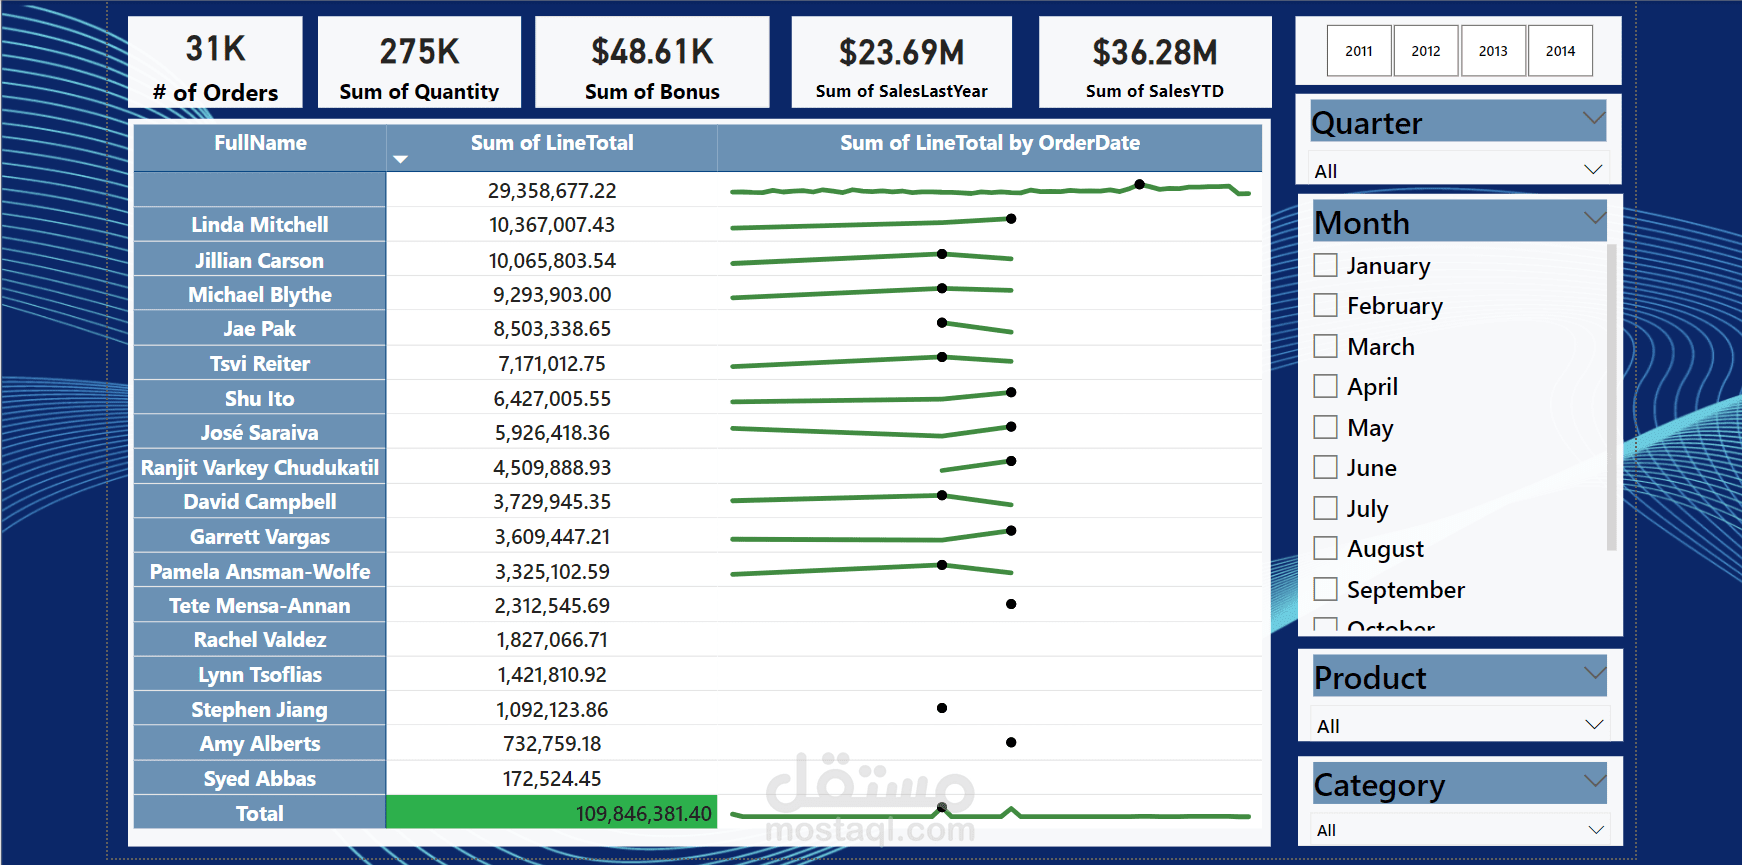
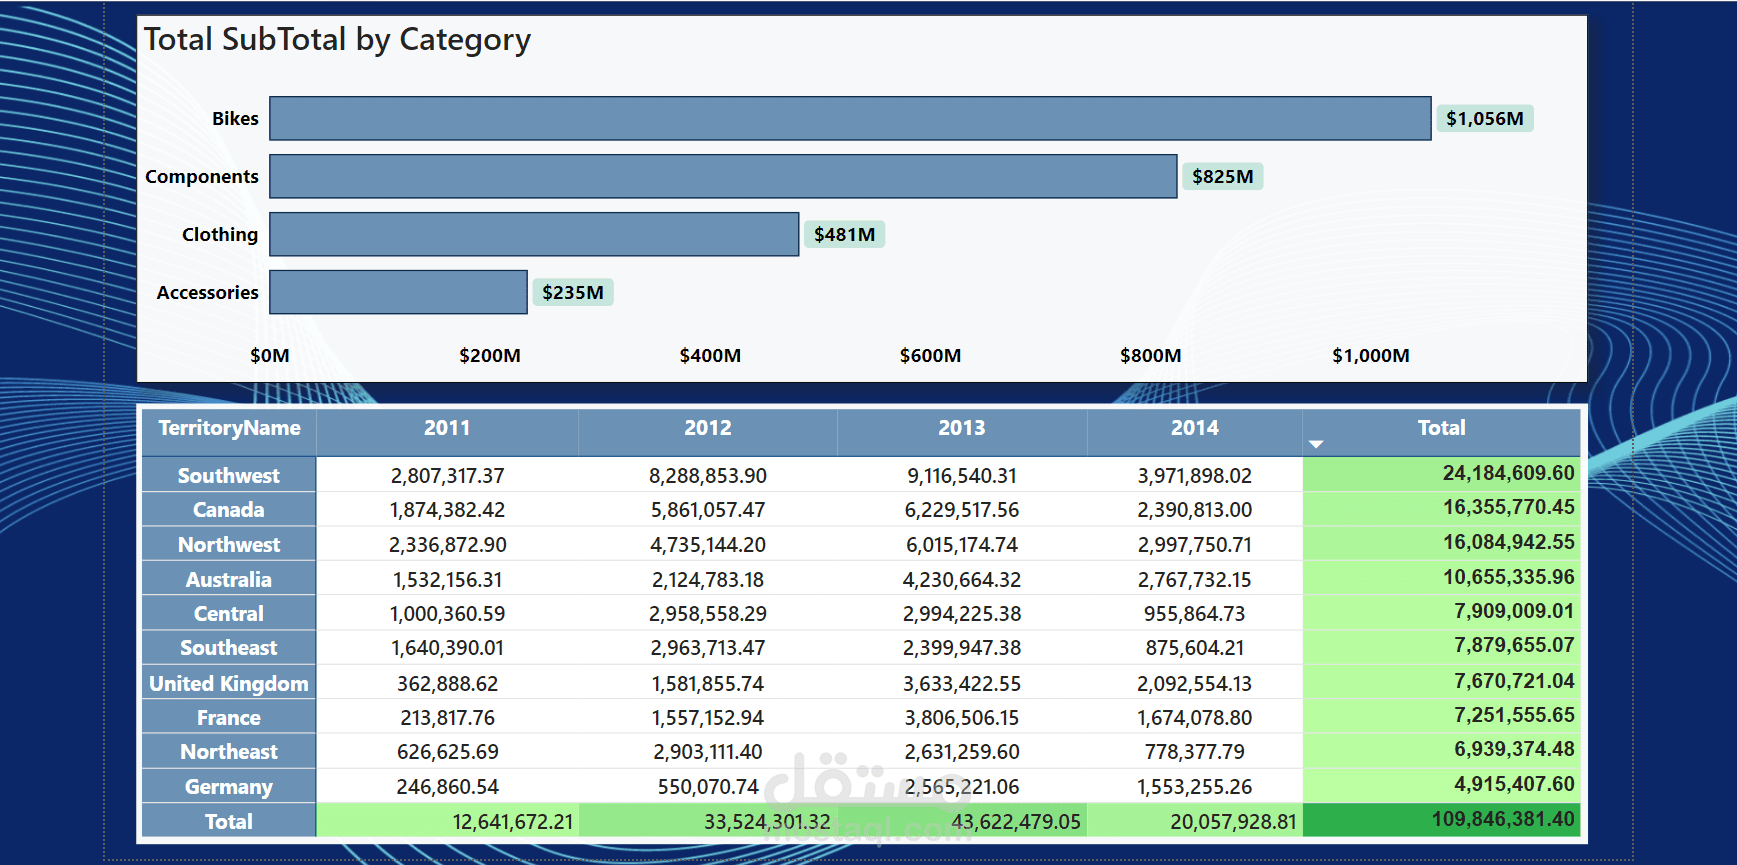
Data Visualization: Created interactive dashboards using Power BI.
Reporting: Summarized findings and prepared reports for stakeholders.