World Cup Data Analysis - Power BI
تفاصيل العمل
Overview :
This project involves an in-depth analysis of World Cup data, providing insightful visualizations and reports on various statistics related to the history of the World Cup.
️ Tools Used :
ETL Tool : Power Query
Analysis and Dashboards Tool : Power BI
Data Source :
Wikipedia: FIFA World Cup
Extracting Data :
Data for this project was extracted from the FIFA World Cup Wikipedia page.
? Cleaning and Preparing Process :
Changing Table Name: Adjusted table names for clarity.
Set First Row as Header: Ensured the first row of the data is used as headers.
Changing Column Names: Renamed columns to meaningful names.
Deleting Unnecessary Columns: Removed columns that were not needed for the analysis.
Changing Data Types: Corrected data types for proper analysis.
Fixing Nulls and Blanks: Addressed missing values and blanks.
Replacing Necessary Values: Replaced values as needed for consistency.
Analysis Process :
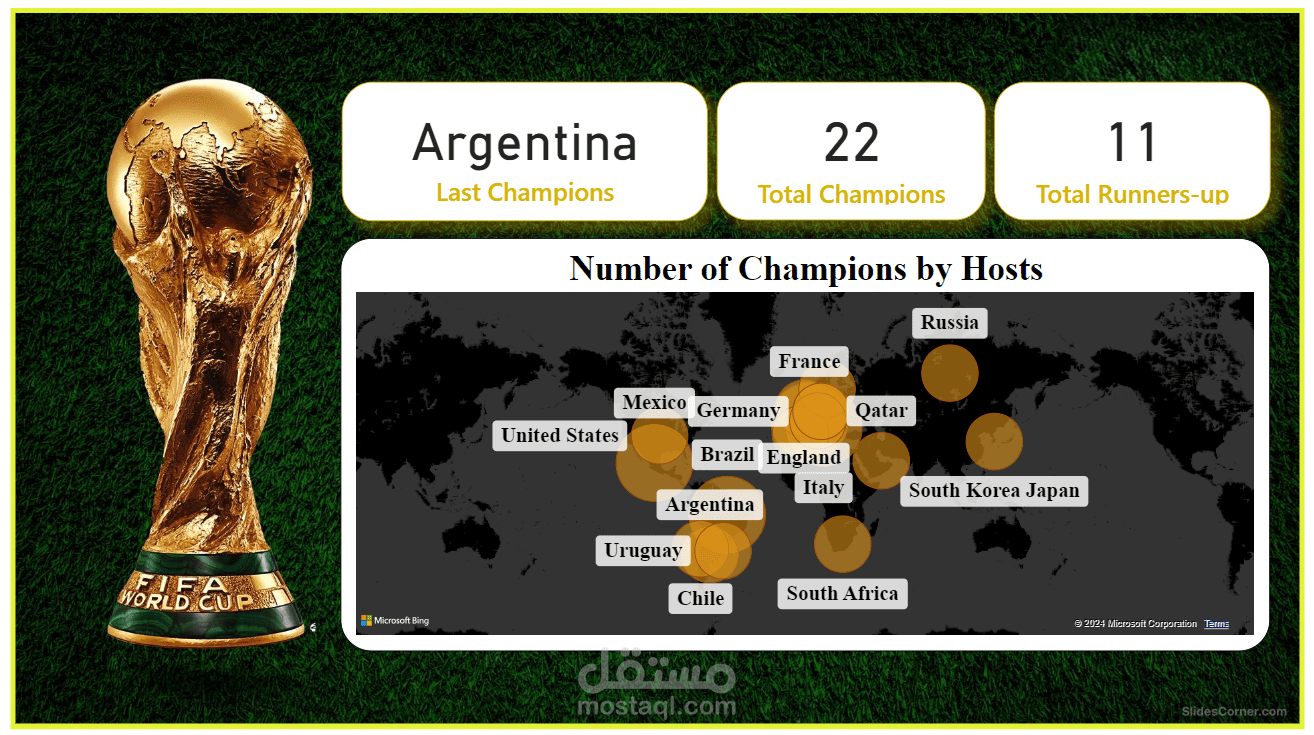
Total Champions: 22
Total Runners Up: 11 ?
Last Champion: Argentina
Championships Hosted by Host Country: Visualized the number of times the championship was hosted by each country on a map.
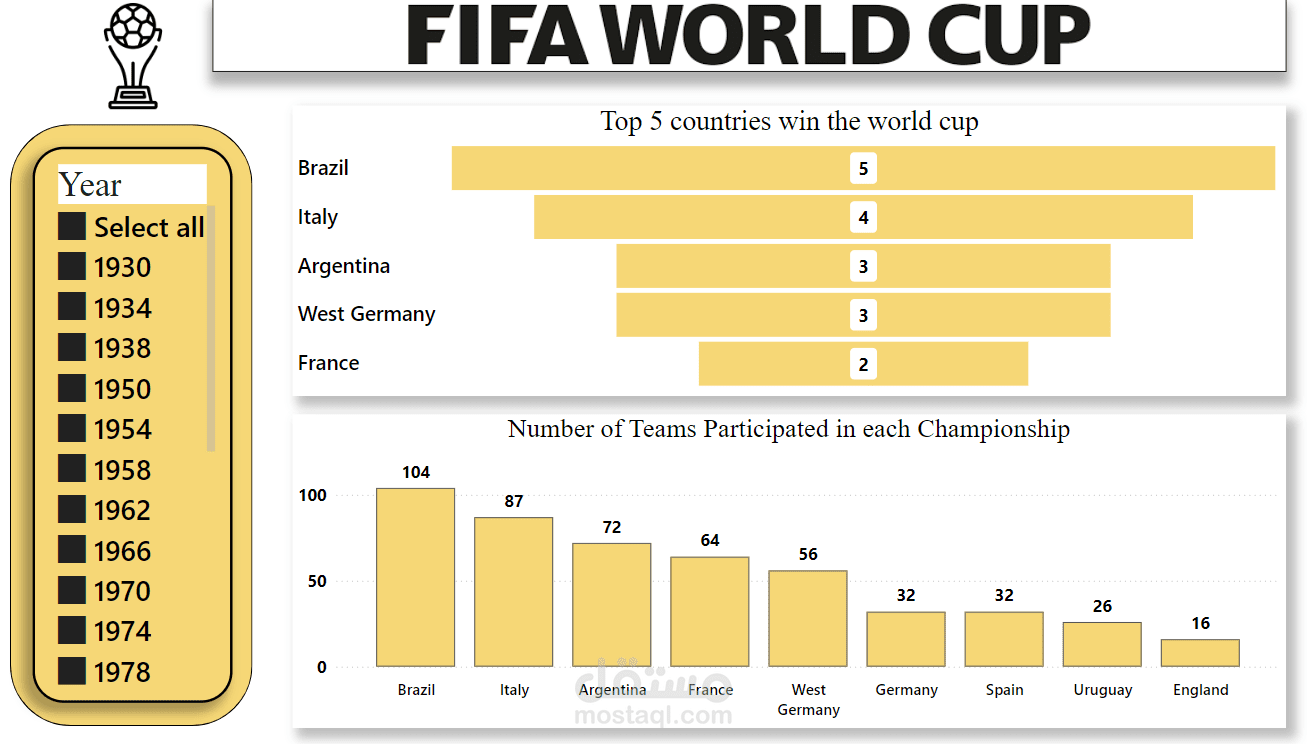
Top 5 Countries Winning the World Cup: Identified the top 5 countries with the most World Cup wins.
Number of Teams in Each Championship: Counted the number of teams that participated in each championship.
Data Table: Presented all relevant fields in a properly ordered table.
Filter by Year: Enabled filtering of the dashboard by the year of the championship.
Visualization Process
Report 1: Detailed analysis and visual representation of the number of champions by hosts.
Report 2: Visualization showcasing the top 5 countries winning the World Cup.