Orders Data Analysis - Power BI
تفاصيل العمل

Overview
This project involves analyzing sales data from an Excel file and visualizing various metrics and insights. The data source for this analysis is Sales.xlsx.
Data Source
File Name: Sales.xlsx
Tools Used
ETL: Power Query ️
Data Modeling: Power BI
Analysis & Dashboards: Power BI
Data Modeling Process
Create fact table, dimension tables, schema, and manage the relations between them.
Data Analysis Process
The following measures were created and visualized:
Number of Orders: 1,465
Order Details: 24,000
Quantity: 86,000
Total Line Total: $30,000,000
Total Tax Amount: $3,000,000
Total Freight Amount: $916,000
Total Due Amount: $34,000,000
Data Visualization Process
Visualizations were created to show the following:
Number of Orders by Order Date
Number of Orders by Status
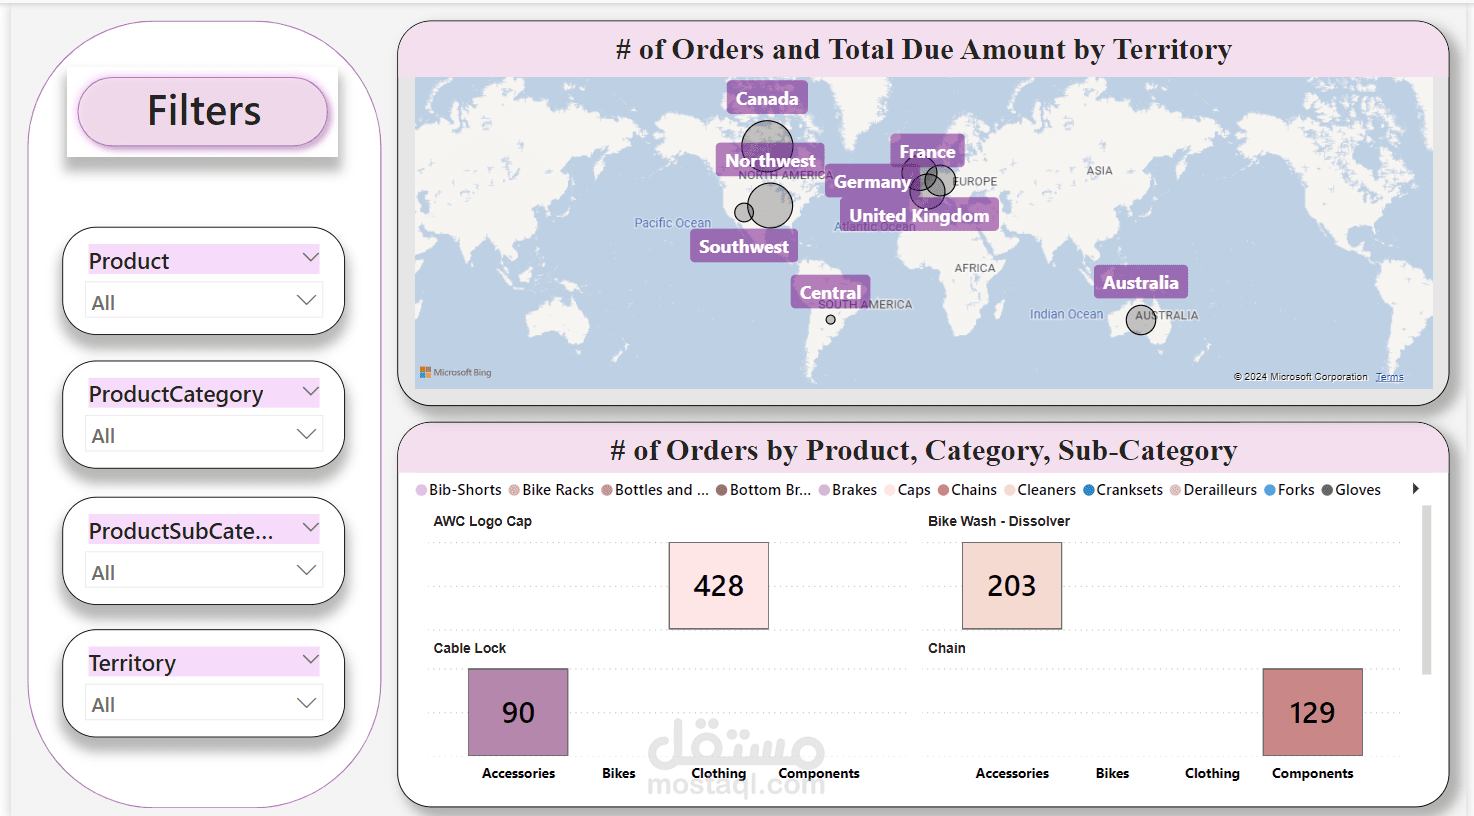
Number of Orders by Category, Subcategory, and Product ️
Number of Orders and Total Due Amount by Territory