Project for analysis dataset
تفاصيل العمل
The Dataset it contains information about the Students, The Dataset has
30641 rows and 15 columns, and it includes variables such as Study hours represent the amount of time each student spends studying per week and,
The exam scores represent the scores students have achieved on them
exams, and more. The Dataset is in CSV format, Which means
it is a comma-separated values file that stores tabular data.
To load the dataset into Jupyter Notebook, I used the pandas,
Which is a popular tool for data analysis and manipulation in Python,
Pandas has a function called read_csv that can read a CSV file from a local or online source and convert it into a pandas as pd, and then I used the
Following code to load the dataset:
Import pandas as pd df = pd.read_csv('Data_student.csv')
The results of the statistical for scores math, reading, writing for student in the Data_student.csv file.
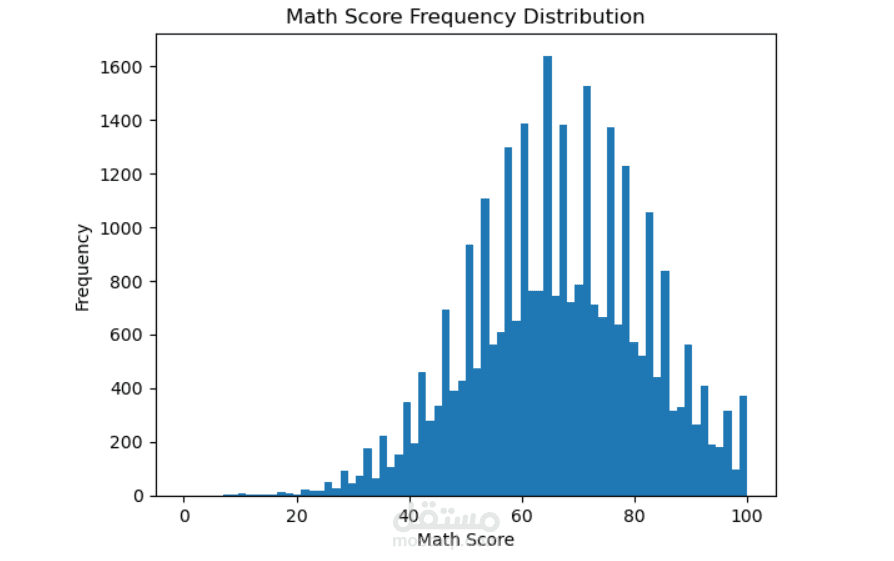
The average MathScore is 66.09, with a standard deviation of 15.36. This means that the typical MathScore is around 66.09, but there is a lot of variation in the scores. The standard deviation measures how much the scores deviate from the average. A larger standard deviation means more variation, and a smaller standard deviation means less variation. The minimum MathScore is 0. This means that the lowest score that any student got in Math is 0. This could indicate that some students did not take the exam, or that they performed very poorly.
The median MathScore is 69.0. This means that the middle score of the sorted scores is 69.0. Half of the students have a score below or equal to 69.0, and half of the students have a score above or equal to 69.0. The median is a measure of the center of the data, and it is not affected by extreme values or outliers. The maximum MathScore is 100. This means that the highest score that any student got in Math is 100. This could indicate that some students performed very well, or that the exam was too easy. The t-statistic is 11.10, which means that the difference between the two groups of students who study more than 10 hours per week and the students who study less than 10 hours per week is 11.10 standard deviations away from zero. This indicates that there is a very large difference between the two groups. The p-value is 0.00, which means that the probability of observing such a large difference by chance is extremely low. This indicates that the difference is highly statistically significant. The correlation of the weekly study hours and the math score is 0.17 means that there is a weak positive relationship between the two variables. This means that the more hours the student study per week, the higher their math score tends to be, and vice versa. However, the relationship is not very strong, and there may be other factors that affect the math score.
The average ReadingScore is 69.37, with a standard deviation of 14.75. This means that the typical ReadingScore is around 69.37, but there is a lot of variation in the scores. The standard deviation measures how much the scores deviate from the average. A larger standard deviation means more variation, and a smaller standard deviation means less variation. The minimum ReadingScore is 10. This means that the lowest score that any student got in Reading is 10. This could indicate that some students did not take the exam, or that they performed very poorly. The median ReadingScore is 69.0. This means that the middle score of the sorted scores is 69.0. Half of the students have a score below or equal to 69.0, and half of the students have a score above or equal to 69.0. The median is a measure of the center of the data, and it is not affected by extreme values or outliers. The maximum ReadingScore is 100. This means that the highest score that any student got in Reading is 100. This could indicate that some students performed very well, or that the exam was too easy. The t-statistic is 5.35, which means that the difference between the two groups of students who study more than 10 hours per week and the students who study less than 10 hours per week is 5.35 standard deviations away from zero. This indicates that there is a large difference between the two groups. The p-value is 8.85 which means that there is a very low probability of observing a test statistic. The correlation of the weekly study hours and the math score is 0.0014 means that there is a very weak positive relationship between the two variables. This means that the more hours the student's study per week, the slightly higher their math score tends to be, and vice versa. However, the relationship is almost negligible, and there may be other factors that affect the math score.
The average WritingScore is 66.55, with a standard deviation of 15.44. This means that the typical WritingScore is around 66.55, but there is a lot of variation in the scores. The standard deviation measures how much the scores deviate from the average. A larger standard deviation means more variation, and a smaller standard deviation means less variation. The minimum WritingScore is 4. This means that the lowest score that any student got in Writing is 4. This could indicate that some students did not take the exam, or that they performed very poorly. The median WritingScore is 69.0. This means that the middle score of the sorted scores is 69.0. Half of the students have a score below or equal to 69.0, and half of the students have a score above or equal to 69.0. The median is a measure of the center of the data, and it is not affected by extreme values or outliers. The maximum WritingScore is 100. This means that the highest score that any student got in Writing is 100. This could indicate that some students performed very well, or that the exam was too easy. The t-statistic is 7.06, which means that the difference between the two groups of students who study more than 10 hours per week and the students who study less than 10 hours per week is 7.06 standard deviations away from zero. This indicates that there is a large difference between the two groups. The p-value is 1.74 means that there is a very low probability of observing a test statistic. The correlation of 0.0097 means that there is a very weak positive relationship between the weekly study hours and the math score. This means that the more hours the student's study per week, the slightly higher their math score tends to be, and vice versa. However, the relationship is almost negligible, and there may be other factors that affect the math score.
The calculated of first quartile (Q1) and the third (Q3) of math, reading,
and writing, which are 58 and 79, respectively. This means that 25% of the students scored below 58, 25% scored between 58 and 79, and 25% scored above 79 in each subject. The IQR for each subject is 79 - 58 = 21, which means that the middle 50% of the students have a score range of 21 points in each subject.
The interquartile range (IQR) of all the exam scores is 21.0 means that the middle 50% of the students have a score range of 21 points in all the subjects combined. This is the same as the IQR for each individual subject, which means that the variability of the scores is consistent across the subjects.