Dynamic Sales Dashboard Using Power BI
تفاصيل العمل
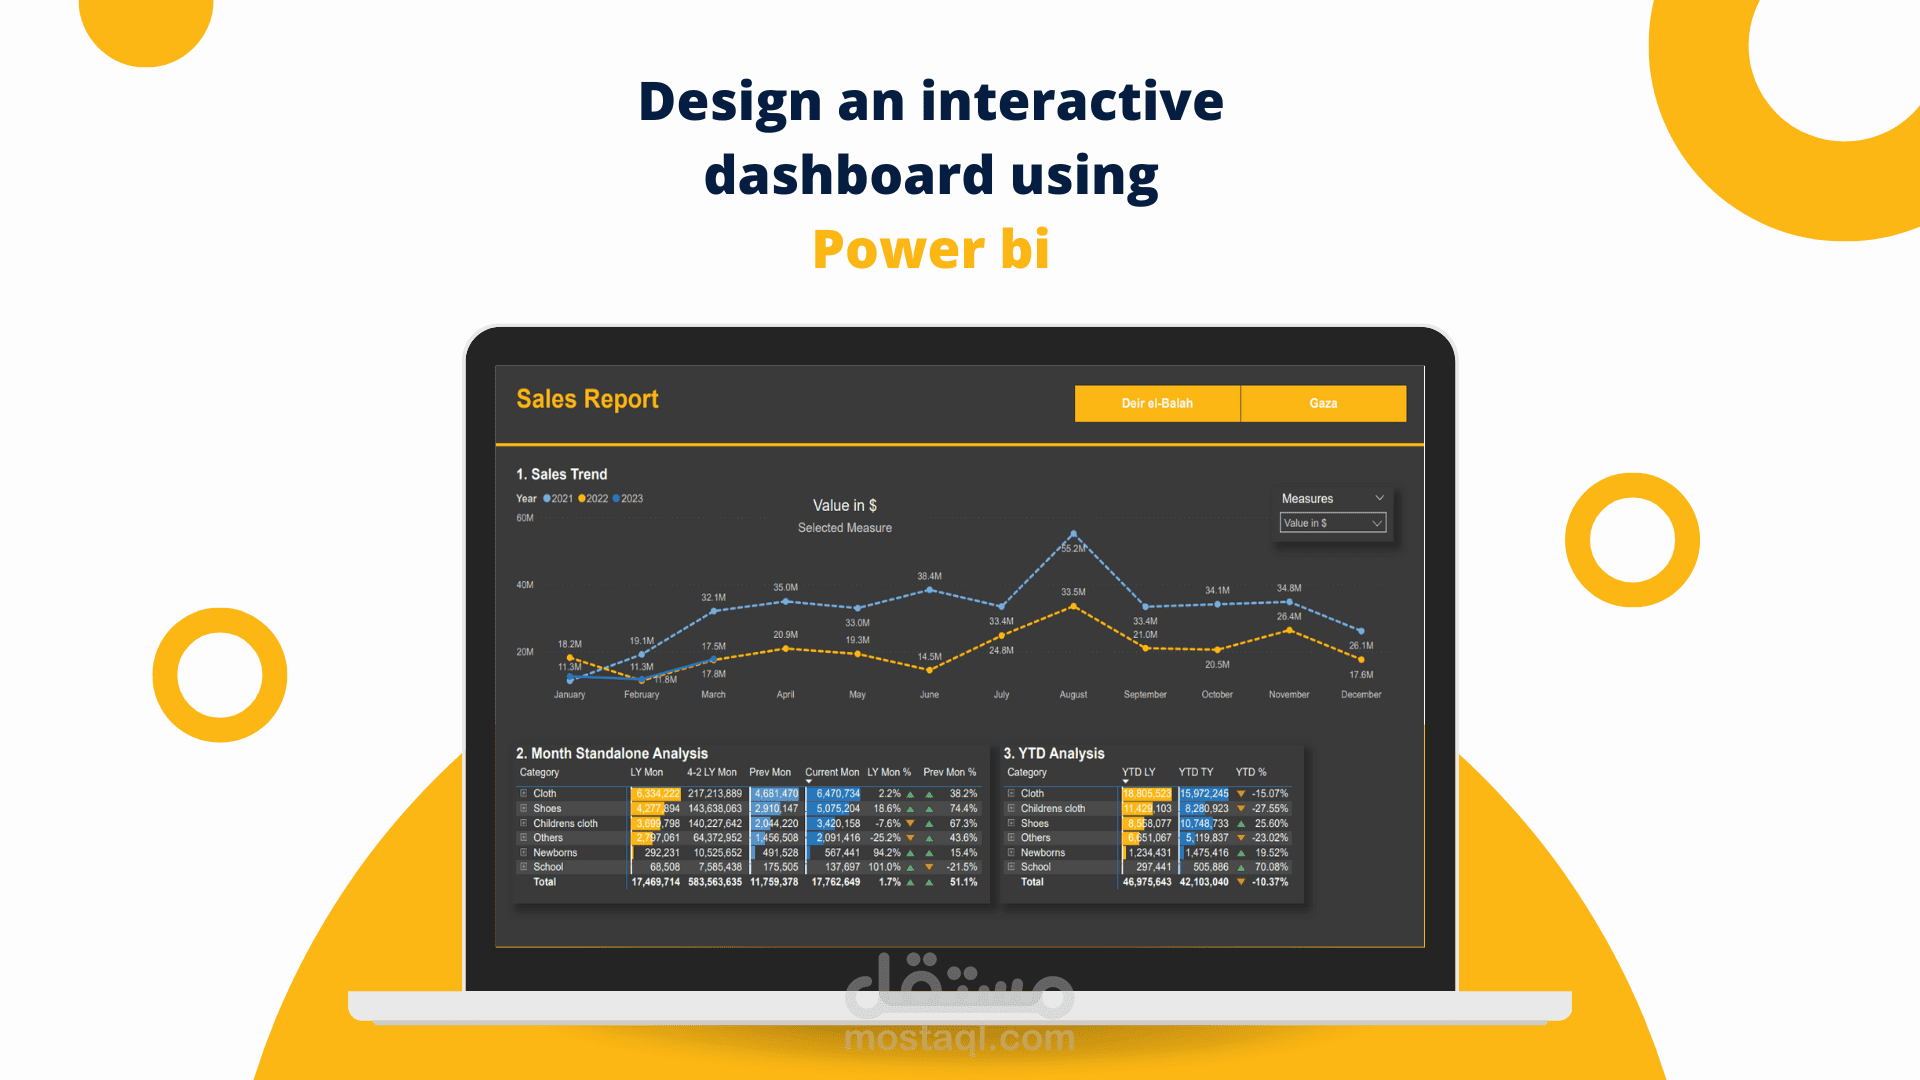
In this project, I developed a comprehensive Dynamic Sales Dashboard using Power BI to provide detailed visual analytics for sales performance. This dashboard aims to offer actionable insights into various sales metrics and trends, helping businesses make informed decisions.
Key Features:
1. Sales Trend Analysis: Visualization of monthly sales trends over multiple years (2021-2023), allowing for quick identification of seasonal patterns and yearly performance comparison.
2. Month Standalone Analysis: Detailed monthly performance comparison across different product categories such as clothing, shoes, children's clothing, newborns, and school supplies. Metrics include Last Year (LY), Previous Month (Prev Mon), and Current Month (Current Mon) sales figures, along with percentage changes.
3. Year-to-Date (YTD) Analysis: Cumulative sales data comparison for the year-to-date period between the current year and the previous year, showcasing growth or decline trends in various categories.
Category Performance: Breakdown of sales performance by product categories, highlighting the best and worst-performing segments.
4. Interactive Filters: Ability to drill down into specific categories, time periods, and other dimensions to customize the analysis according to user needs.
Tools and Technologies:
1. Power BI: Utilized for creating interactive and visually appealing dashboards.
2. Data Modeling: Implemented robust data modeling techniques to ensure accurate and efficient data analysis.
3. DAX (Data Analysis Expressions): Employed DAX formulas to create custom calculations and metrics.