pet point _dashboard
تفاصيل العمل
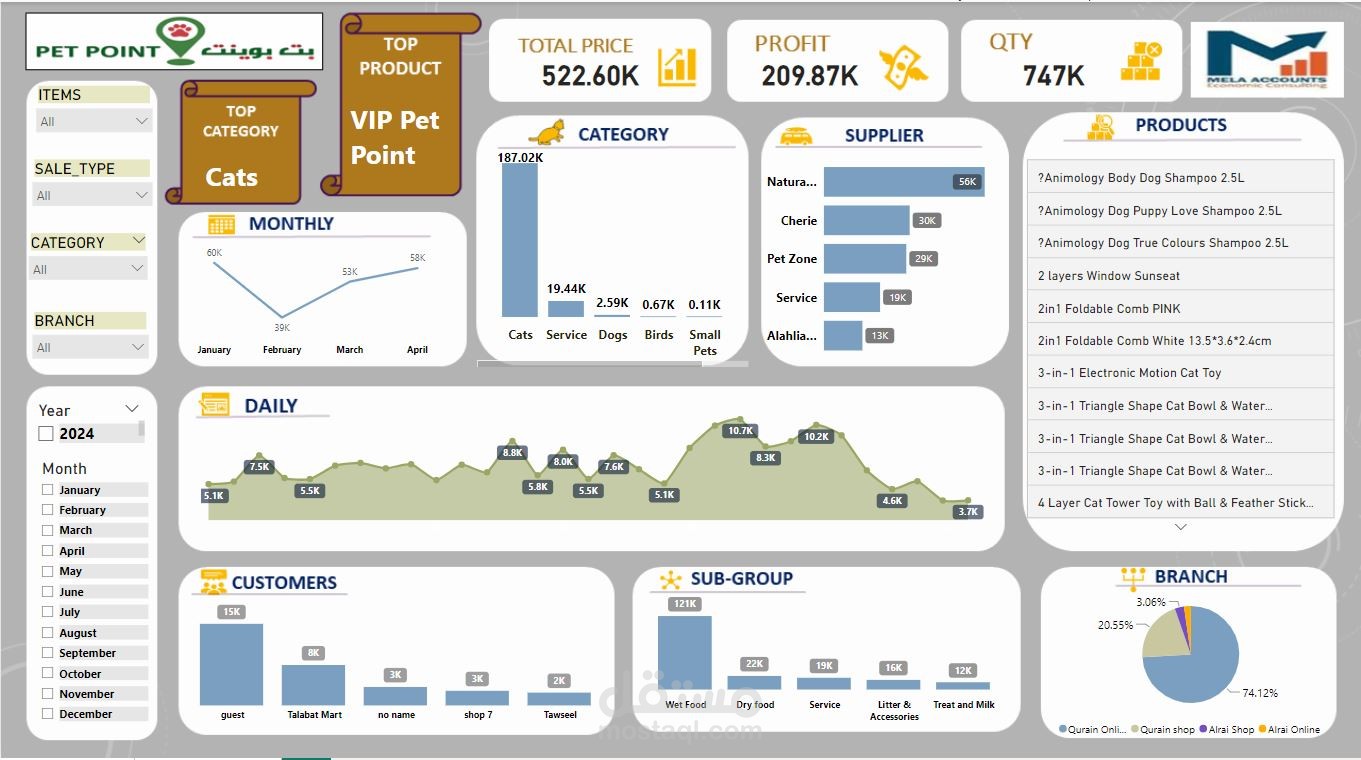
• Extract data from PDF files and convert it to Excel format, Employed Python libraries for data extraction and manipulation.
• Used power query to standardize department and supplier names , extract Q1 2023 and Q1 2024 data.
• Utilized Power BI to create interactive and insightful dashboards for visualizing departmental, product, and branch data, Conducted thorough analysis and interpretation of departmental, product, and branch data to identify trends and insights.
• Identified issues such as sales decline and formulated effective solutions and strategies for business improvement.
• Presented analysis findings, insights, and recommendations effectively using the Power BI dashboard, facilitating informed decision-making.