Visual Dashboard using Power BI
تفاصيل العمل
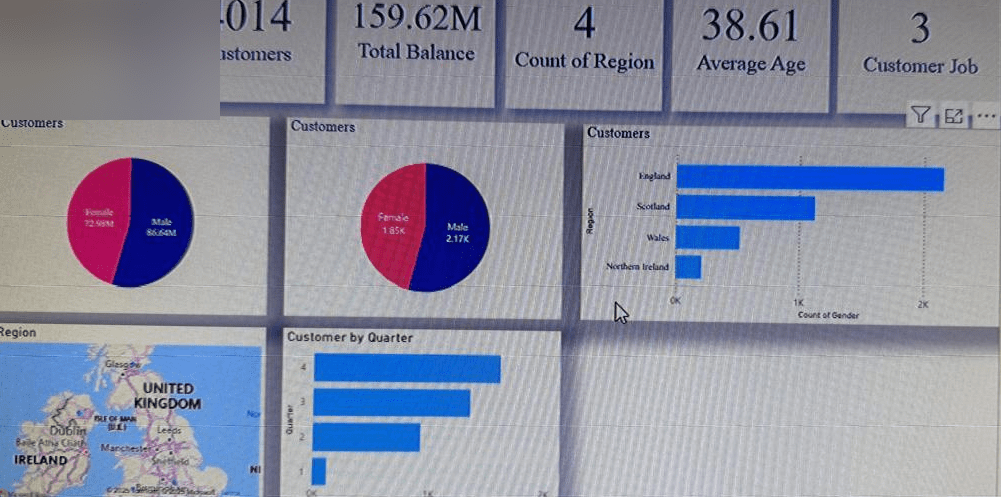
Power BI dashboard delivers an overview of customer and financial data, featuring KPIs such as total balance, customer count, and average age. It visualizes customer distribution by gender, region, and time period, with interactive filters to explore quarterly and regional trends. The dashboard transforms raw data into clear insights, supporting management in tracking performance and making informed decisions.