Hospitality Domain BI Report
تفاصيل العمل
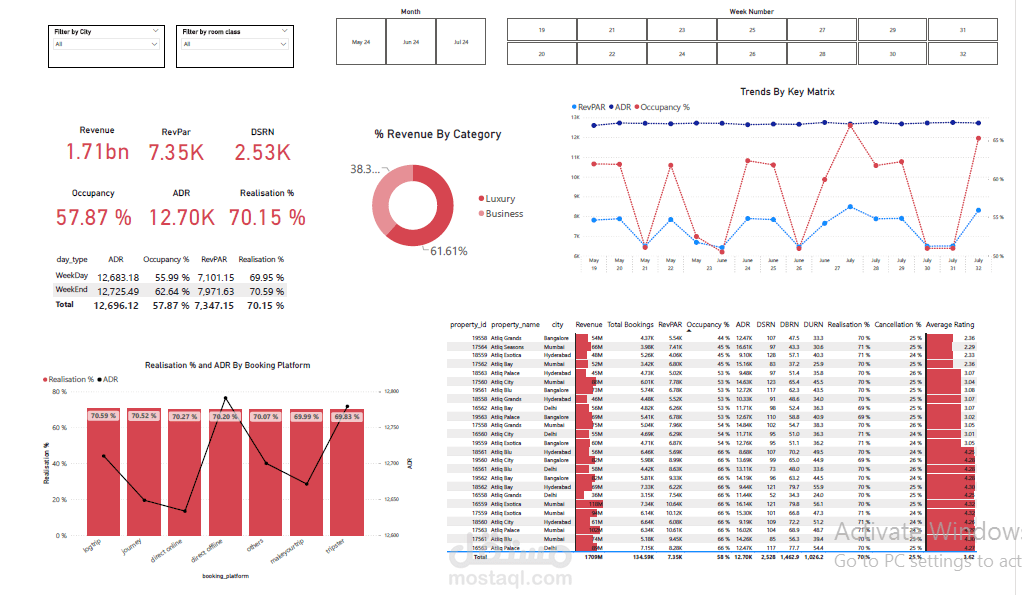
A BI report that highlights the KPIs of a hotel chain dataset spanning across 3 months. Data was transformed using Power Query Editor and an appropriate data model was created in Power BI. DAX measures that represent key metrics were created and a final report followed.
Step 1: importing data into Power bi
Step 2: Data transformation that included:
Checking data types
Setting correct headers
Removing unnecessary columns
Cleaning of text values
Step 3: Applied a star schema, as we have two fact tables and three dim tables, established the correct relationships between the tables
Step 4: Created new week and day Calculated columns using date/time formulas and created 26 measures, varying in complexity and leveraging the various powerful dax formulas
Step 5: Visualization of data and report creation