Power BI Analysis ( Customer churn ) داش بورد فعالة
تفاصيل العمل

انشاء داش بورد احترافية باستخدام power bi tools
- customer churn Analysis project
1. Process Steps
• Data Import : Load the customer dataset (CSV) into Power BI.
• Data Cleaning:
- Handle missing || null values.
- Convert categorical fields .
- Create calculated measures using DAX.
• Data Modeling:
- Create Measures such as:
- Churn Rate = DIVIDE(CALCULATE(COUNTROWS(CustomerTable), CustomerTable[Churn]="Yes"), COUNTROWS(CustomerTable))
- Avg Tenure Retained = AVERAGEX(FILTER(CustomerTable, CustomerTable[Churn]="No"), CustomerTable[tenure])
- Avg Tenure Churned = AVERAGEX(FILTER(CustomerTable, CustomerTable[Churn]="Yes"), CustomerTable[tenure])
• Visualization:
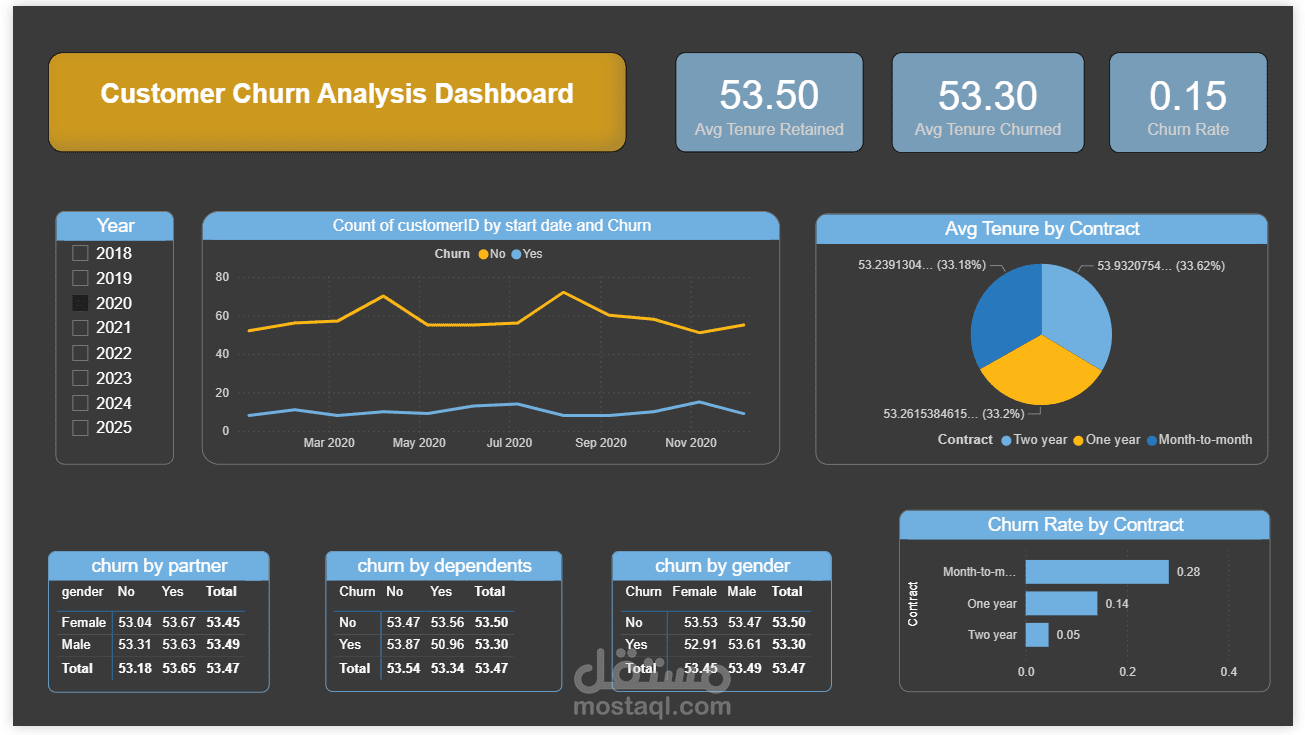
- KPI Cards (Churn Rate, Avg Tenure Retained, Avg Tenure Churned).
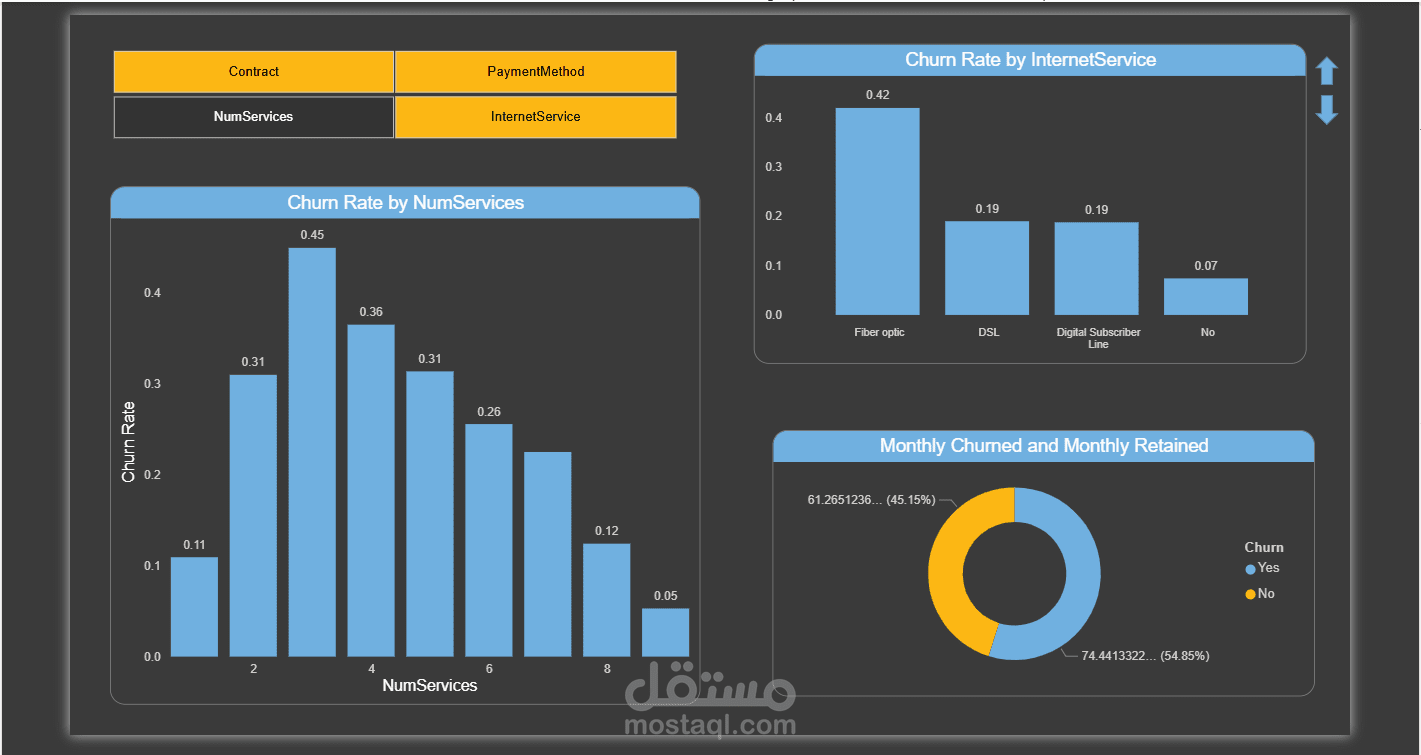
- Bar Charts (Churn Rate by Contract, Internet Service).
- Donut Chart (Tenure distribution by Contract Type).
- Line Chart (Churn trend over time).
- Matrix (Churn by Gender, Dependents, Partner).
2. Key Findings
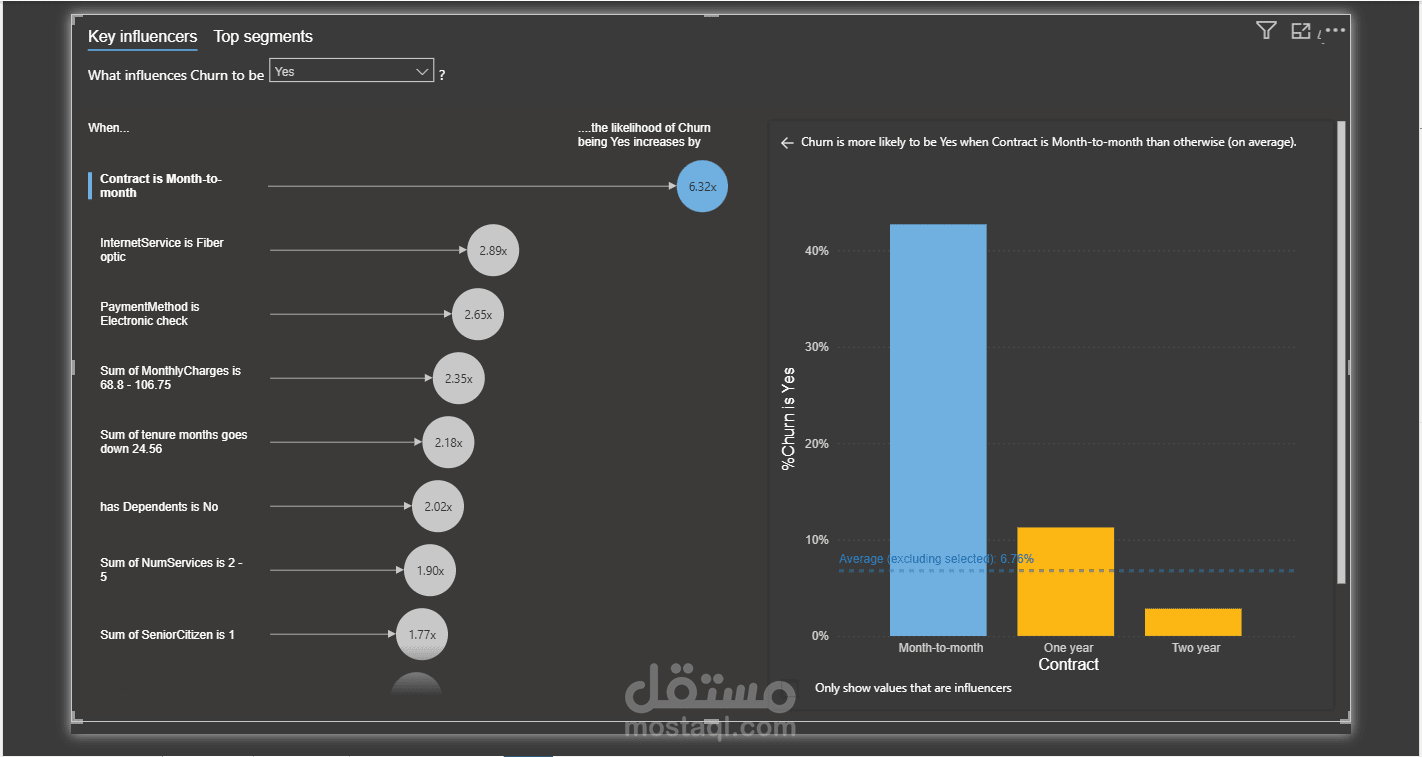
• Month-to-Month contract customers show the highest churn rate.
• Fiber optic internet service customers have significantly higher churn.
• Two-Year contract customers show the lowest churn rate.
• The average tenure of retained customers is almost double that of churned customers.
• Churn trends show gradual increases between 2018 and 2024.