Sales Management Dashboard
تفاصيل العمل
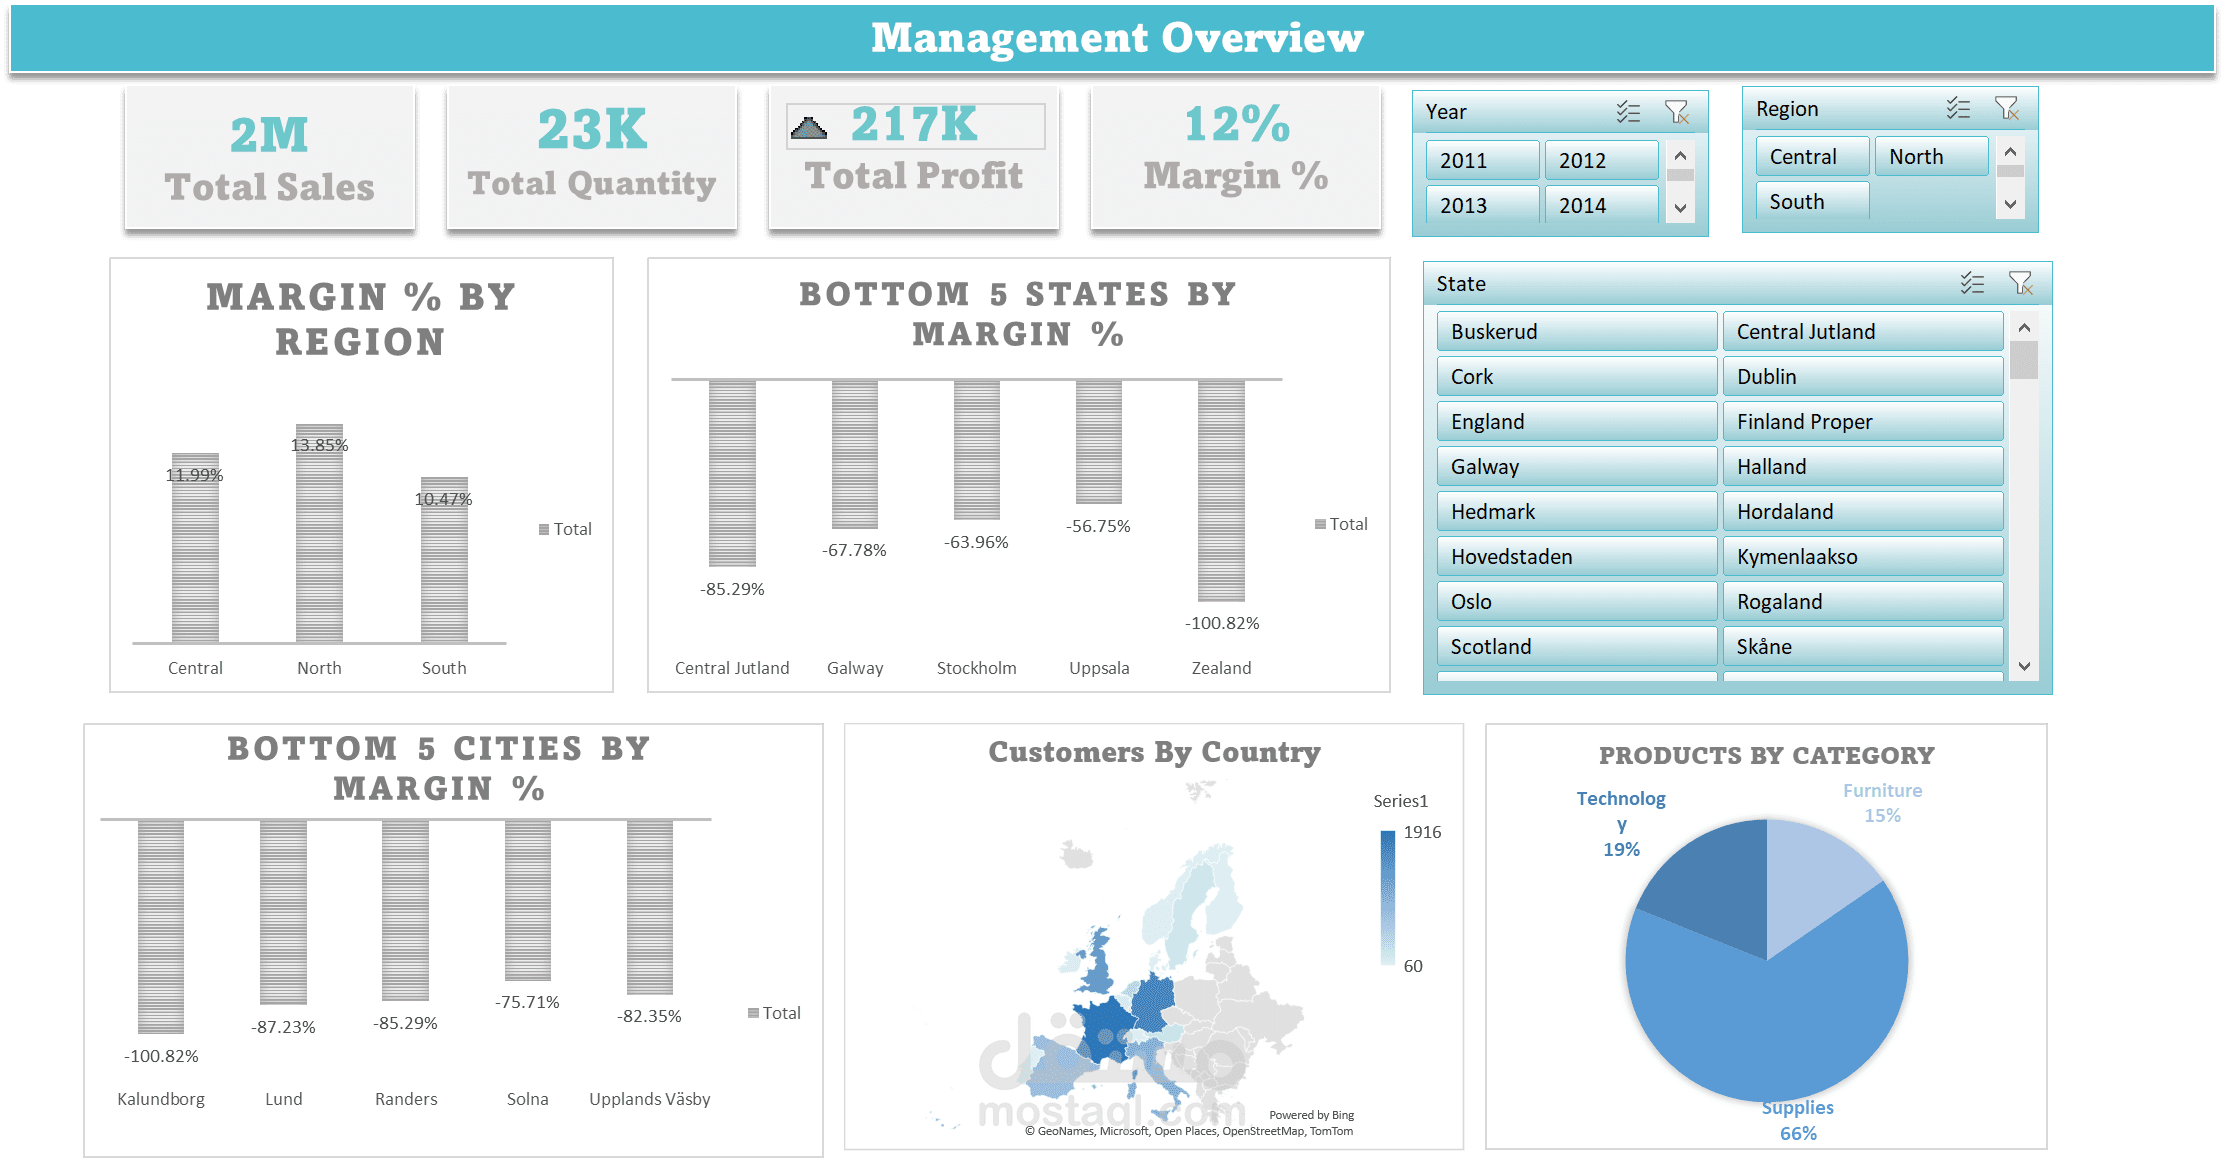
Key Performance Indicators (KPIs) :
- Total Sales : Track revenue generated over time to identify trends and opportunities.
- Total Quantities : Monitor product movement and demand to optimize inventory management.
- Margin Percentage : Gauge profitability and ensure healthy margins for sustainable growth.
Year Slicer :
- Seamlessly analyze performance trends across different time periods, enabling you to make informed decisions based on historical data.
Charts for Enhanced Visualization :
1. Margin by Region : Visualize margin distribution across various regions to pinpoint areas for improvement and capitalize on high-margin regions.
2. Bottom 5 States by Margin with Region Slicer : Identify states with lower margins within specific regions, facilitating targeted strategies for margin optimization.
3. Bottom 5 Cities by Margin with State Slicer : Drill down further to city-level insights to uncover localized factors impacting margins and devise localized solutions.
? Pie Chart for Product Categories :
- Gain a comprehensive overview of product performance by category, enabling strategic allocation of resources and marketing efforts.
️ Map Visualization for Customer Distribution :
- Geospatially visualize customer distribution across different countries to identify untapped markets and tailor marketing strategies accordingly.
Our dashboard provides a holistic view of your sales performance, allowing you to make data-driven decisions with confidence. Say goodbye to guesswork and hello to strategic excellence! Get in touch with us today to unlock the full potential of your sales operations.