Global super store sales
تفاصيل العمل
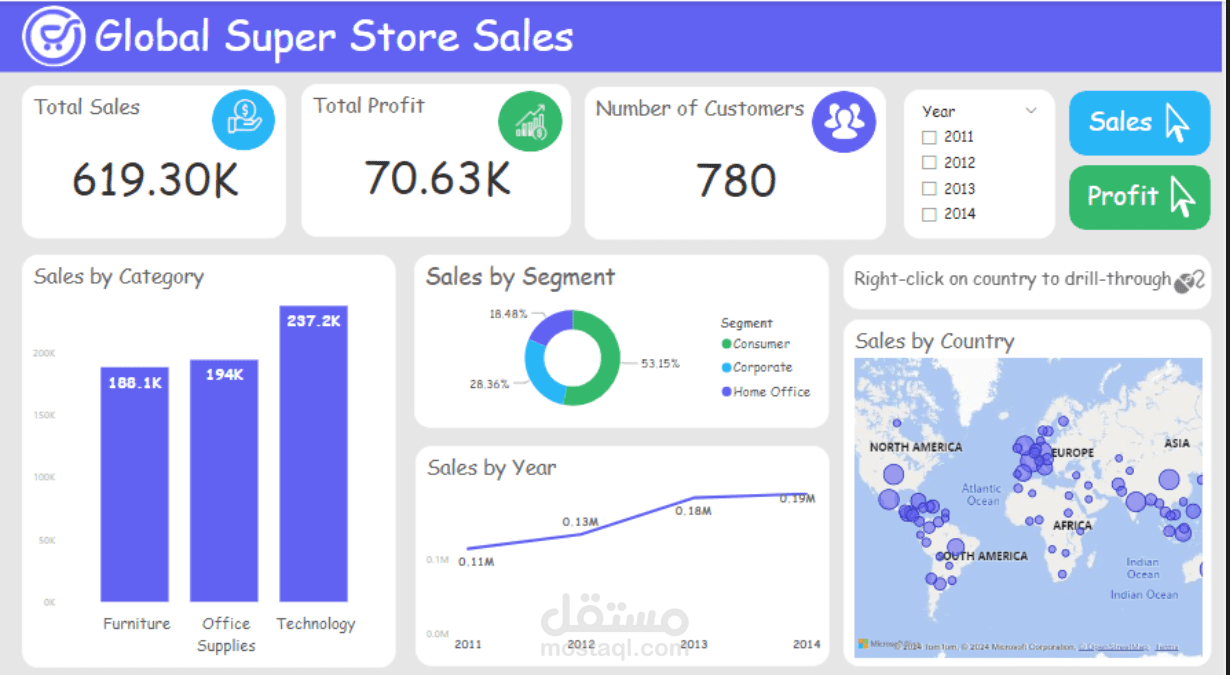
Sales Performance Overview:
Total Sales: Sum of all sales transactions within a specified time period, providing an overall snapshot of revenue generation.
Sales Growth: Percentage increase or decrease in sales revenue compared to a previous period, indicating the sales trajectory.
Year-over-Year (YoY) Comparison: Comparison of sales performance with the same period in the previous year to identify growth patterns.
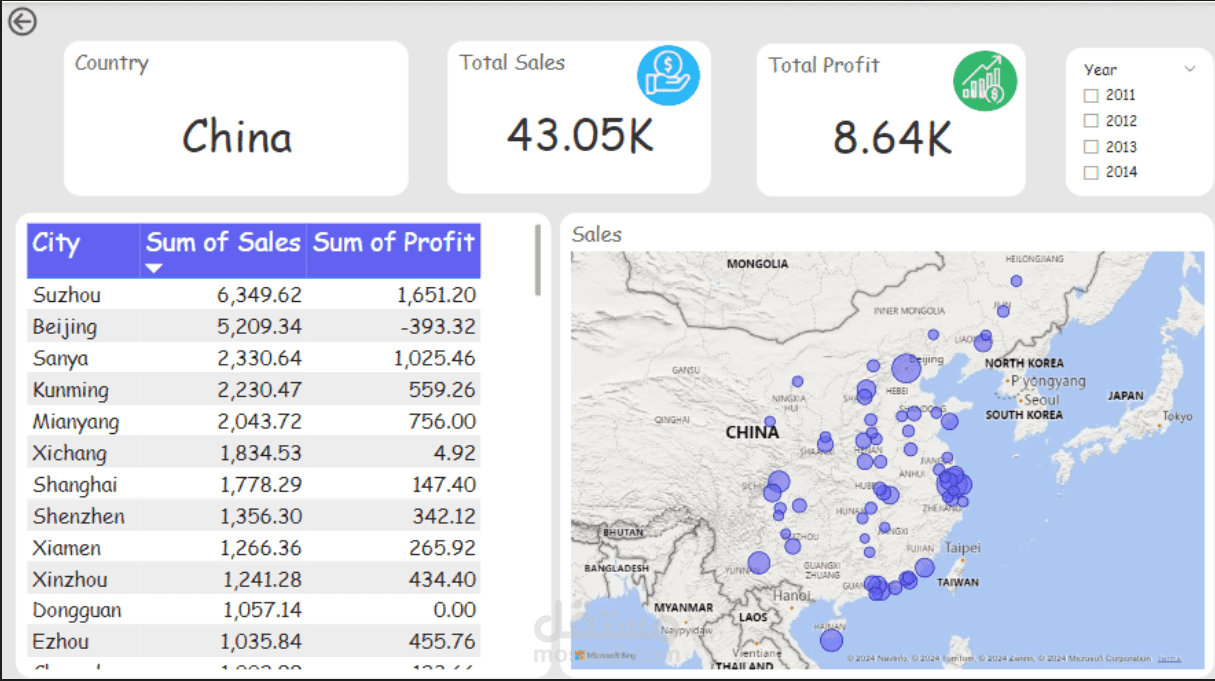
Geographic Analysis:
Sales by Region: Breakdown of sales revenue by different geographic regions or territories, highlighting areas of strength and opportunities for expansion.
Regional Comparison: A comparison of sales performance among different regions to identify top-performing markets and areas for improvement.
Product Category Analysis:
Sales by Product Category: Breakdown of sales revenue by different product categories (e.g., electronics, furniture, office supplies), allowing for analysis of product performance.
Product Category Comparison: Comparison of sales performance among different product categories to identify top-selling products and underperforming categories.
Customer Segmentation:
Sales by Customer Segment: Analysis of sales revenue by different customer segments (e.g., corporate clients, individual consumers), helping to identify high-value customer segments.
Customer Segment Comparison: Comparison of sales performance among different customer segments to tailor marketing and sales strategies accordingly.
Time Trend Analysis:
Monthly/Quarterly Sales Trend: Visualization of sales trends over time to identify seasonality patterns and sales cycles.
Sales Forecasting: Prediction of future sales based on historical data, enabling proactive planning and resource allocation.
Profitability Analysis:
Gross Profit Margin: Calculation of gross profit margin to assess the profitability of sales.
Contribution Margin: Analysis of contribution margin by product category or region to identify areas for cost optimization and margin improvement.
Order Analysis:
Average Order Value: Calculation of the average value of each sales order, providing insights into customer purchasing behavior.
Order Quantity: Analysis of the number of products sold per order, helping to understand customer preferences and shopping patterns.
Customer Retention and Acquisition:
Customer Lifetime Value (CLV): Prediction of the future value of customers based on their purchase history, aiding in customer relationship management.
Customer Acquisition Cost (CAC): Calculation of the cost associated with acquiring new customers, helping to evaluate the effectiveness of marketing and sales efforts.
Data Visualization and Interactivity:
Graphs, charts, and interactive visualizations to present sales data in a clear and understandable format.
Drill-down capabilities allowing users to explore specific data points and conduct deeper analysis.
Real-time Updates and Alerts:
Ability to update data in real-time or near real-time to provide the most current insights.
Alerts and notifications for significant changes or deviations from expected sales performance.
The Global Super Store Sales dashboard serves as a powerful tool for executives, sales managers, and analysts to gain actionable insights into sales performance, identify trends, and make informed decisions to drive business growth and profitability on a global scale.
بطاقة العمل
| اسم المستقل | Ibrahim A. |
| عدد الإعجابات | 0 |
| عدد المشاهدات | 10 |
| تاريخ الإضافة | |
| تاريخ الإنجاز |