عمل استبيان باستخدام spss
تفاصيل العمل
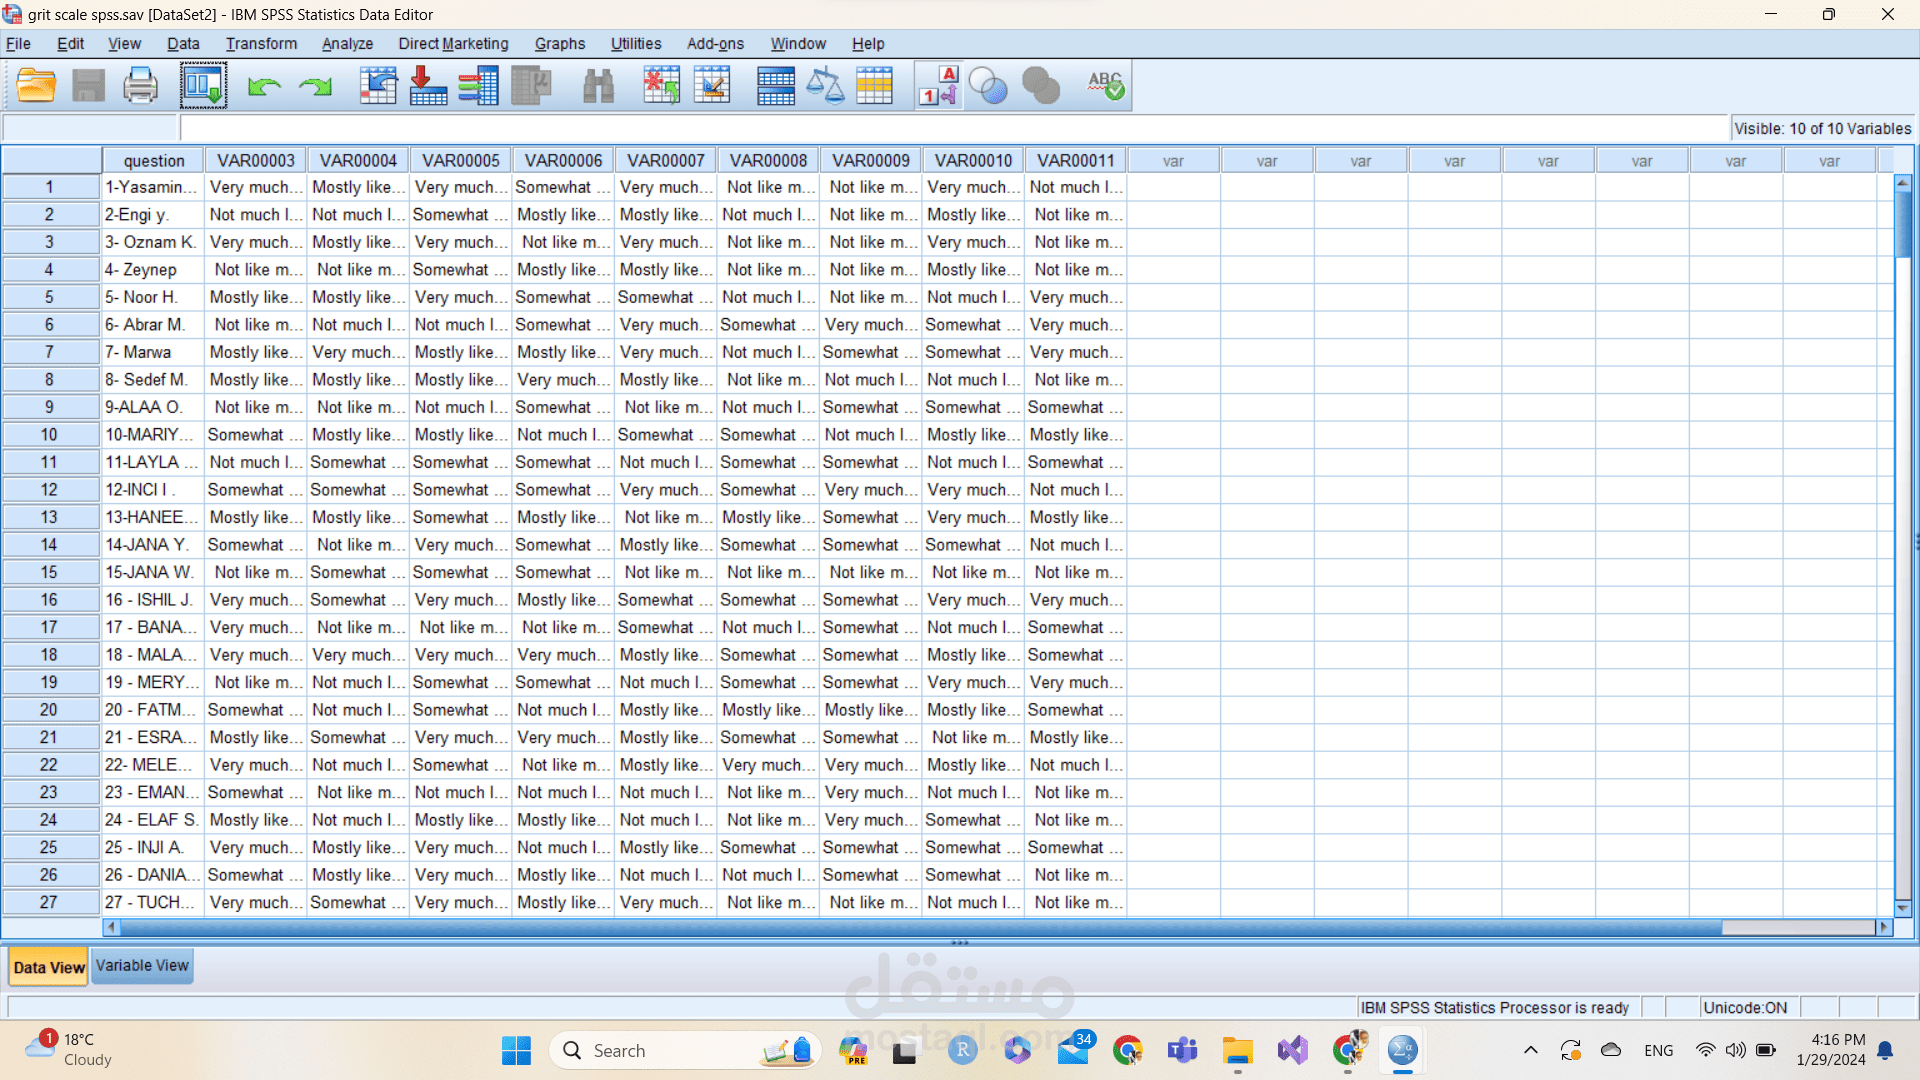
this excel data that has been re-enterd on spss with caution and number to verify each statement and convert it from just qulitative data into quantitive data and using spss then i was able to extract statistical graph (pie chart) and preform mathematical equation on it and simulate different situation using regreesion