Adventure Work Dashboard
تفاصيل العمل
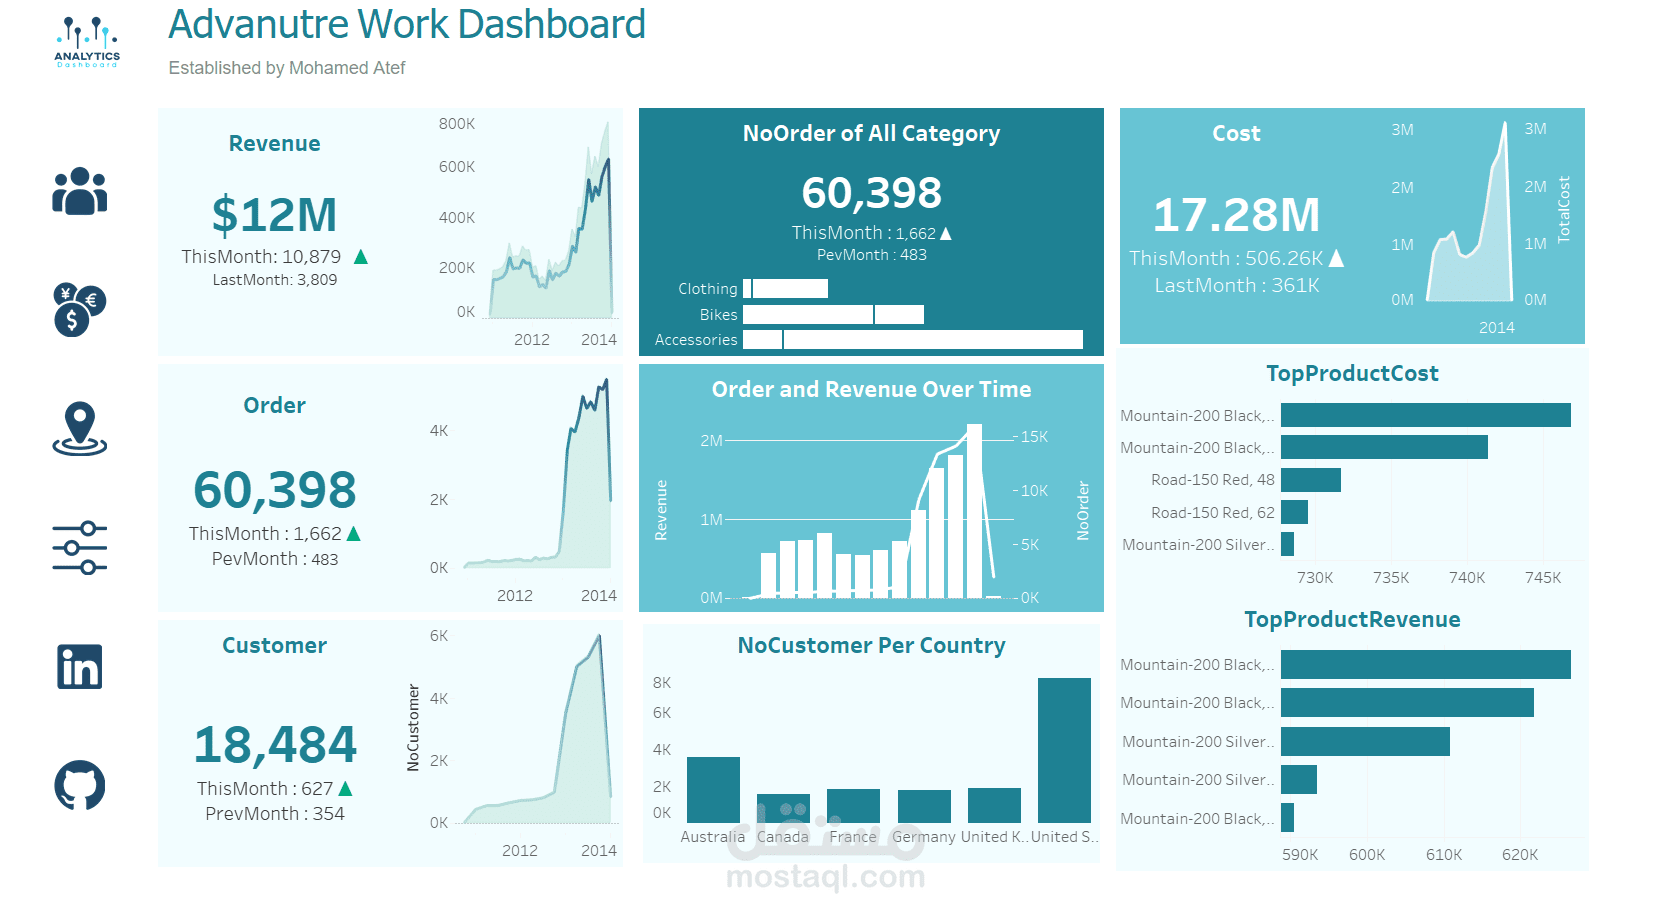
Utilized Tableau's powerful capabilities to calculate and visualize total revenue, orders, and customers, providing a comprehensive overview of business performance.
Category-wise Orders:
Dived into the dataset to analyze the number of orders for different product categories, shedding light on which segments are driving sales.
Total Cost and KPIs:
Calculated and visualized the total cost of operations, ensuring a balanced perspective. Key Performance Indicators (KPIs) were derived to measure and track business efficiency.
Orders and Revenue Over Time:
Implemented time series analysis to understand how orders and revenue fluctuate over time. Unveiled trends, patterns, and potential seasonality factors.
Customer Distribution by Country:
Explored the geographic dimension by breaking down the number of customers in each country. Insights into regional customer bases can inform targeted strategies.
Top Product Revenue and Cost:
Identified the top-performing products in terms of revenue and compared it against the associated costs. Ensured a focus on high-impact, profitable items.
The Dashboard Journey :
Data Prep:
Imported Adventure Works dataset into Tableau, ensuring data cleanliness and relevance.
Calculated Fields:
Crafted calculated fields for crucial metrics, including KPIs, product revenue, and cost.
Visualization Magic:
Leveraged Tableau's drag-and-drop interface to create insightful visualizations, from bar charts for product categories to line charts for time series analysis.
Geographic Exploration:
Unveiled the power of Tableau's mapping features to present the distribution of customers across different countries.
Interactivity and User-Friendly Design:
Incorporated filters and parameters for a user-friendly experience, allowing stakeholders to interact dynamically with the data.ds.