Startups Expansion Analysis
تفاصيل العمل
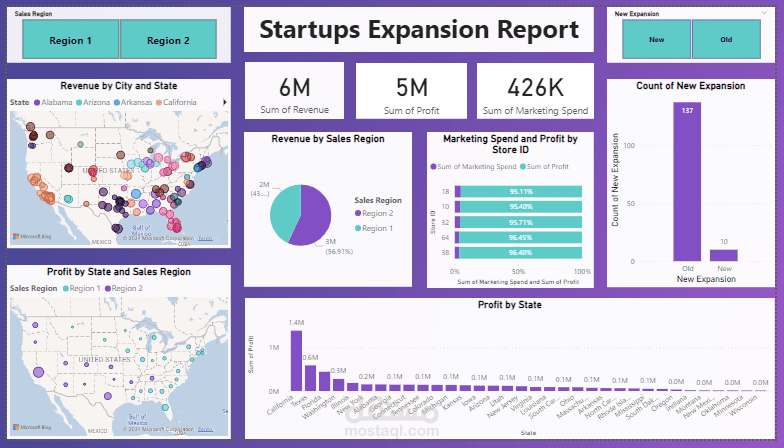

My project 'Startups Expansion Report' using Python and Power BI!
First, I did an exploration of the data and some statistical analysis using Python Pandas library.
Then I built some insights and it turned out that:
1- Sum of Revenue for "Region 2" (3,298,914) was higher than "Region 1"(2,497,671).
2- "California" had the highest Profit (1,390,222) and "Wisconsin" had the lowest Profit (14,868).
3- Average of Profit was higher for "Region 2" (254,153) than "Region 1"(105,501).
4- We have 137 old expansions and only 10 new ones.