Shopping Trends Analysis
تفاصيل العمل

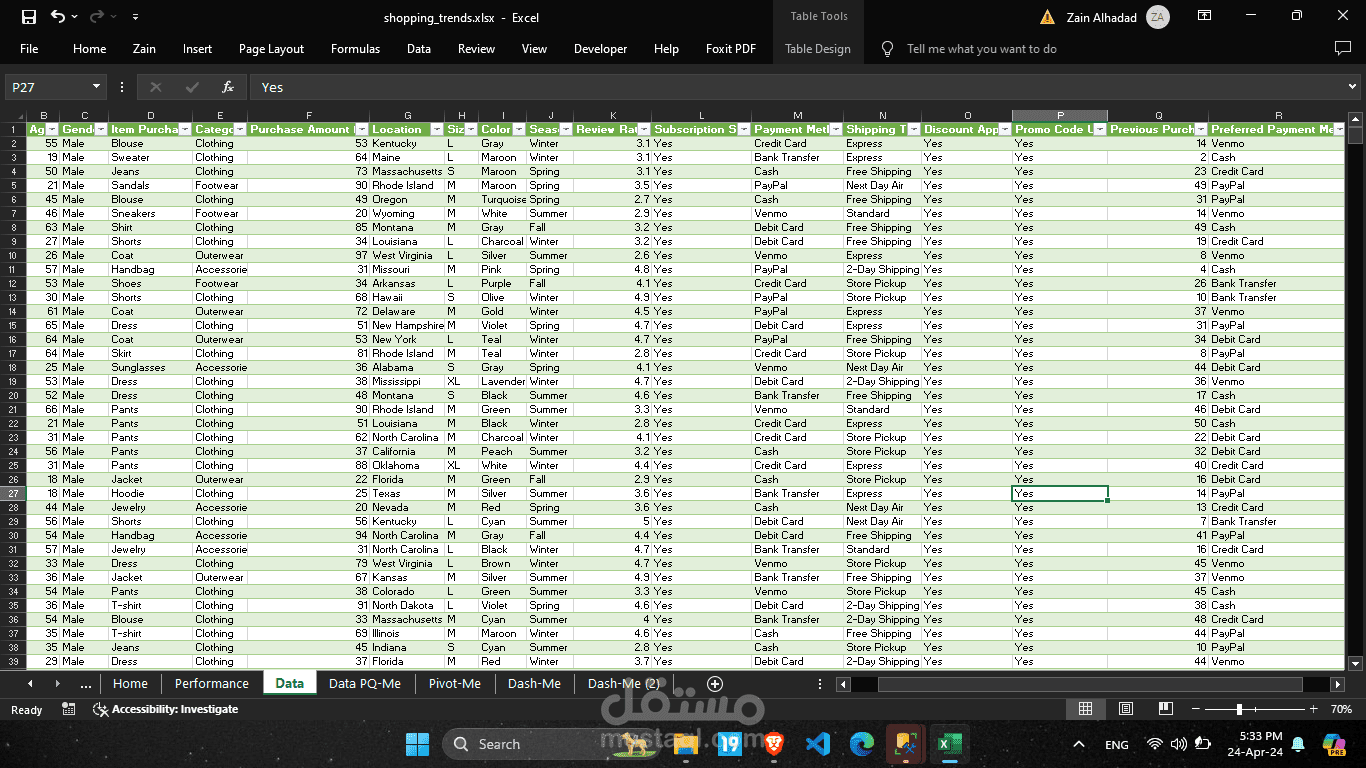
My Project 'Shopping Trends' using only MS Excel:
1-Explore the data.
2-Clean and transform the data and make sure all is good.
3-Insert Pivot Tables and build Charts.
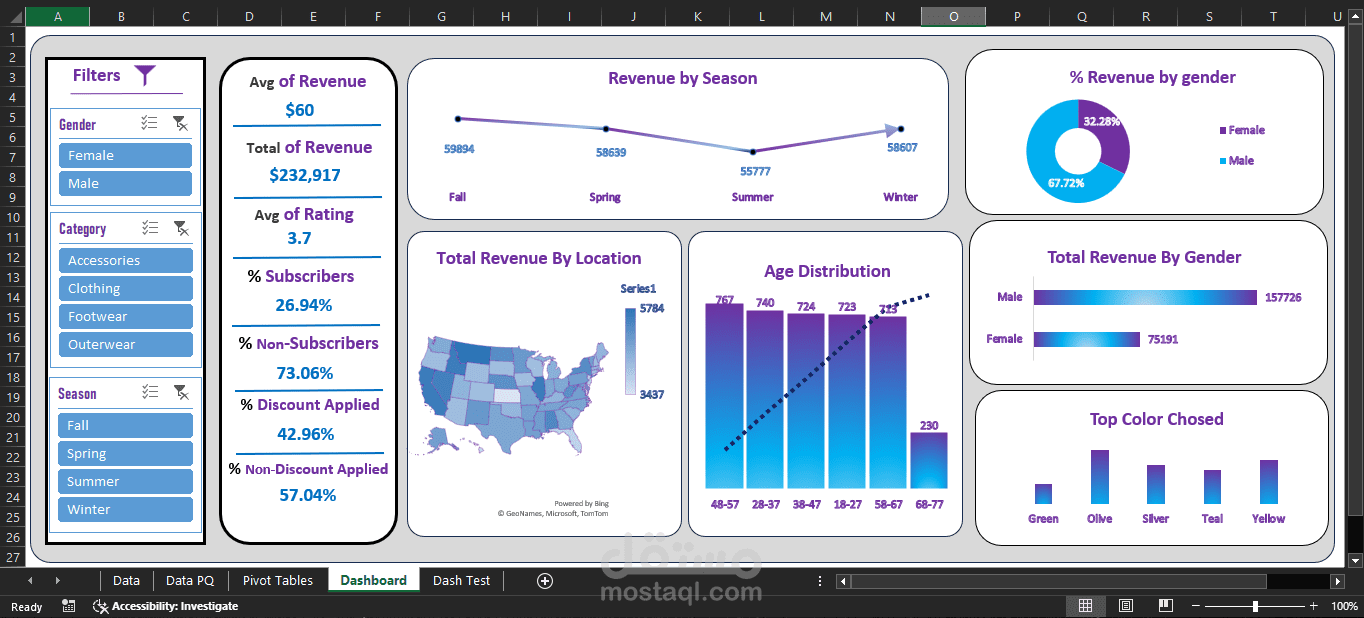
4-Building an interactive Dashboard!
Statistical analysis and Charts In Dashboard:
-- Average of Revenue
-- Total of Revenue
-- Avg of Rating
-- % Subscribers / Non-Subscribers
-- % Discount / Non-Discount Applied
-- Revenue by Season Using Line Chart
-- Total Revenue By Location Using Map Chart ️
-- Age Distribution Using Histogram Chart
-- % Revenue by gender Using Pie Chart
-- Total Revenue By Gender Using Bar Chart
-- Top Color Chosed Using Column Chart