Mapping the Skies of Delay: My Data Journey with Airline Delays and Power BI
تفاصيل العمل

Every journey begins with a single step—and for me, it started with a CSV file from Kaggle. That dataset, full of flight delays and their causes, sparked a passion for unlocking insights that could transform air travel.
I harnessed the power of Power BI to transform raw data into actionable insights. Here's my journey:
1. Data Discoveries:
- Extracted insights from a 2008 Airline Delays dataset from Kaggle
- Built a robust star schema with one fact table and multiple dimensions using Power Query and M language, ensuring efficient analysis and exploration.
2. Dashboard Design:
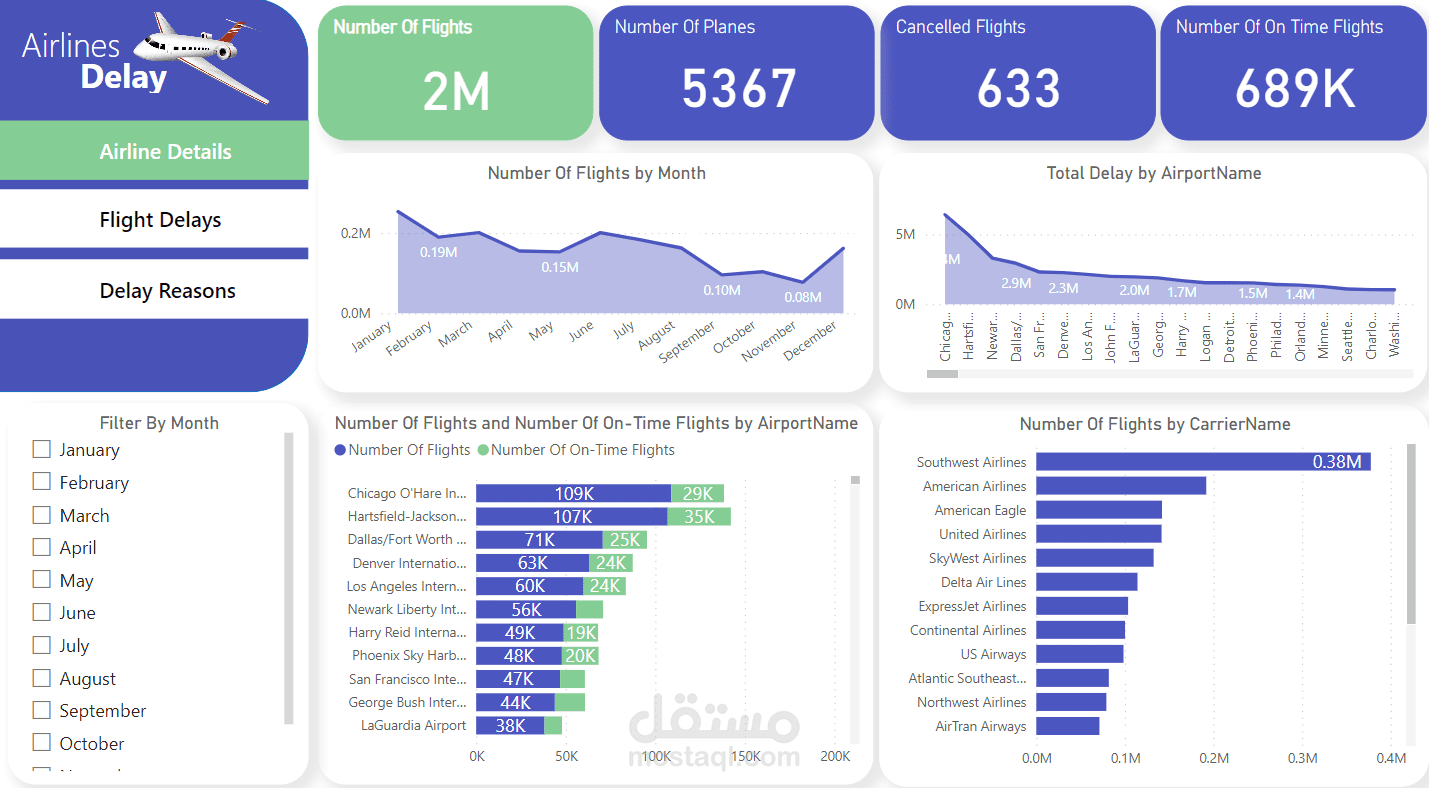
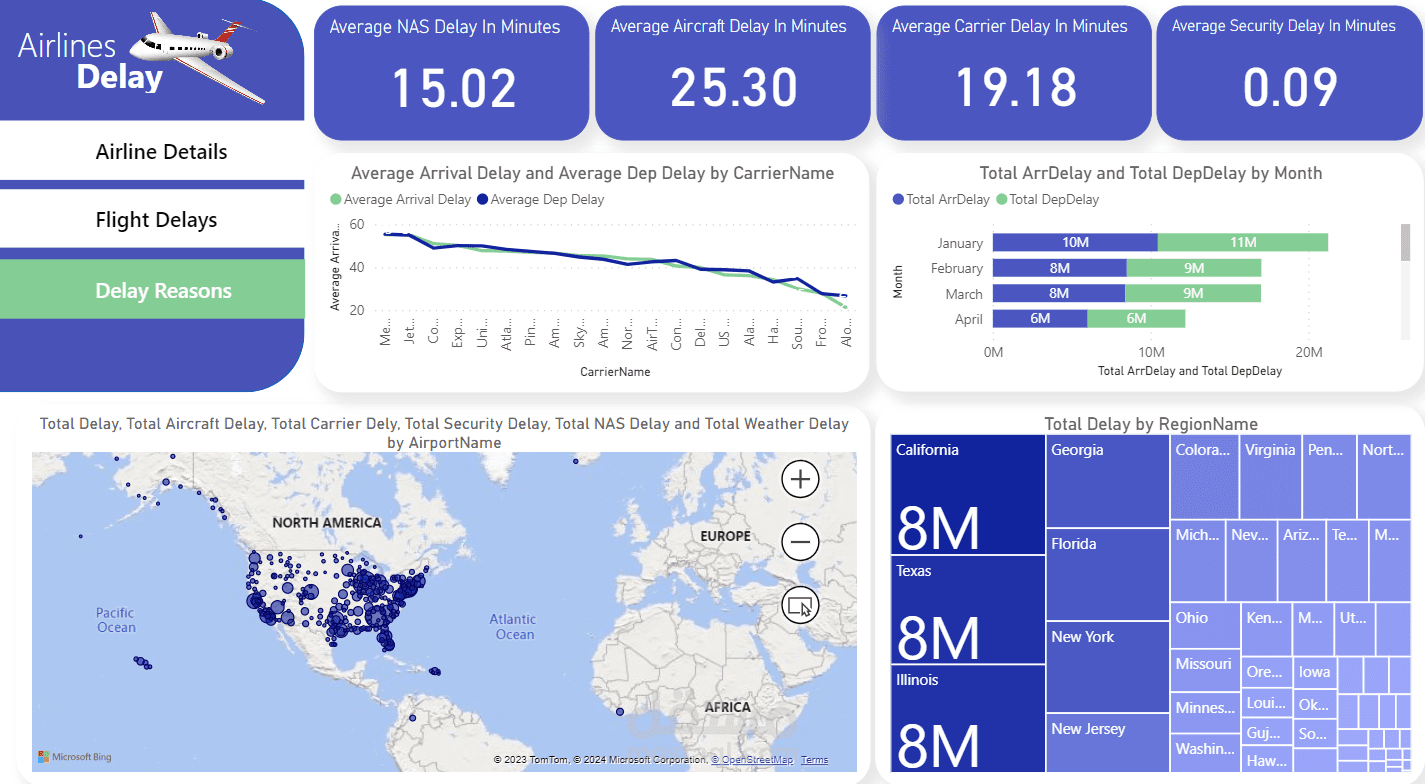
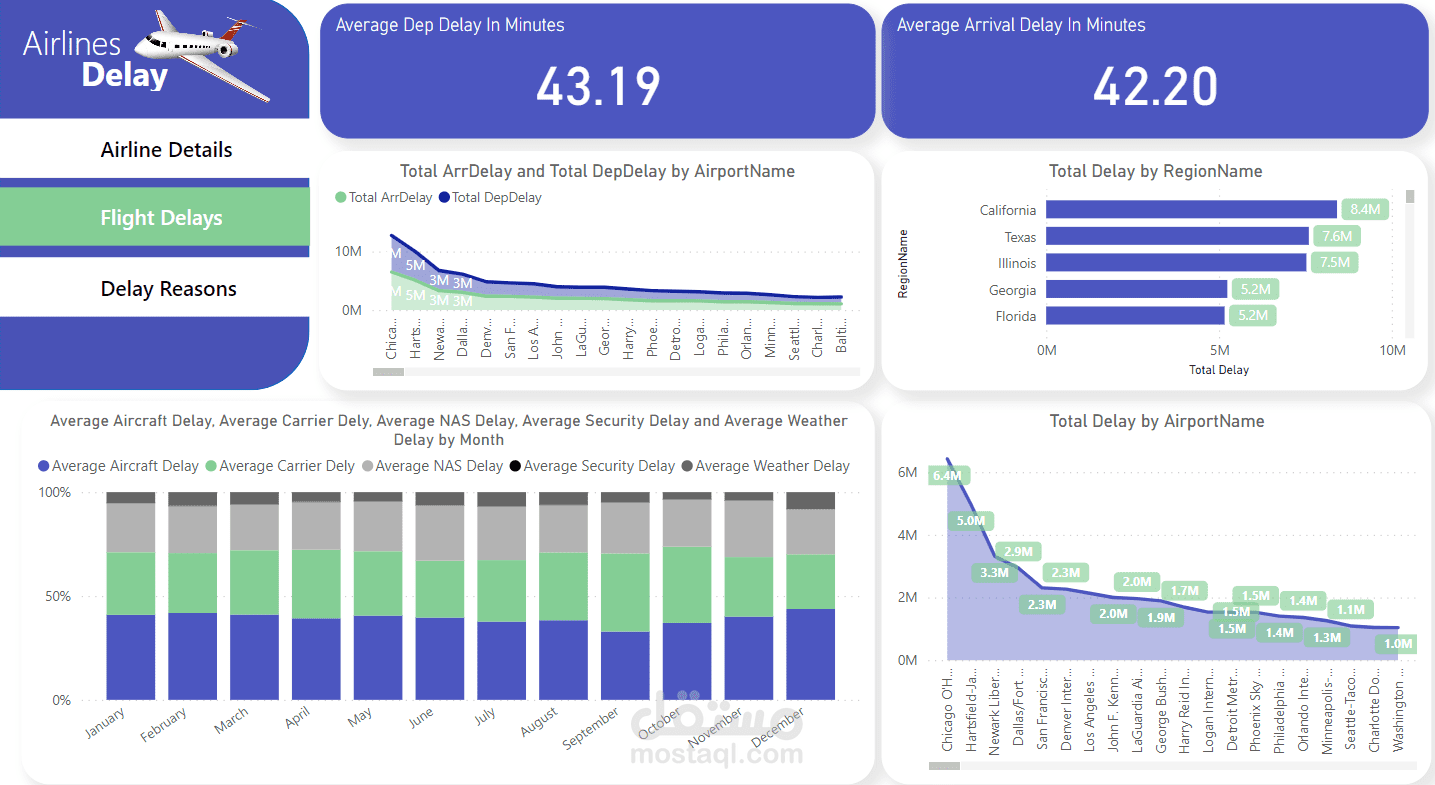
- Crafted an interactive Power BI dashboard with three pages: Airline Details, Flight Delays, and Delay Reasons.
- Visualized flight volumes, delay patterns, carrier performance, and regional trends with charts and maps.
3. DAX Mastery:
- Utilized DAX measures for dynamic calculations, unlocking deeper insights into delay causes, averages, and totals.
Technical Prowess:
- Data modeling and transformation using Power Query and M language.
- Star schema design for efficient analysis.
- DAX measures for dynamic calculations.
- Interactive visualization techniques.