Navigating the AdventureWorks Sales Landscape with Interactive Dashboards
تفاصيل العمل

Drowning in data? AdventureWorks was. Sales figures piled high, customer trends remained murky, and product performance was veiled in uncertainty. Enter a Power BI dashboard crafted with an explorer's spirit, transforming raw numbers into actionable insights and illuminating the ever-shifting terrain of AdventureWorks sales.
Charting the Course:
Star Schema: A robust foundation laid, data organized for efficient exploration. Products, categories, subcategories, dates – their relationships mapped, ready to be unraveled.
Product Hierarchy: A climbing path built, scaling from broad categories to individual items, pinpointing winners and revealing hidden gems.
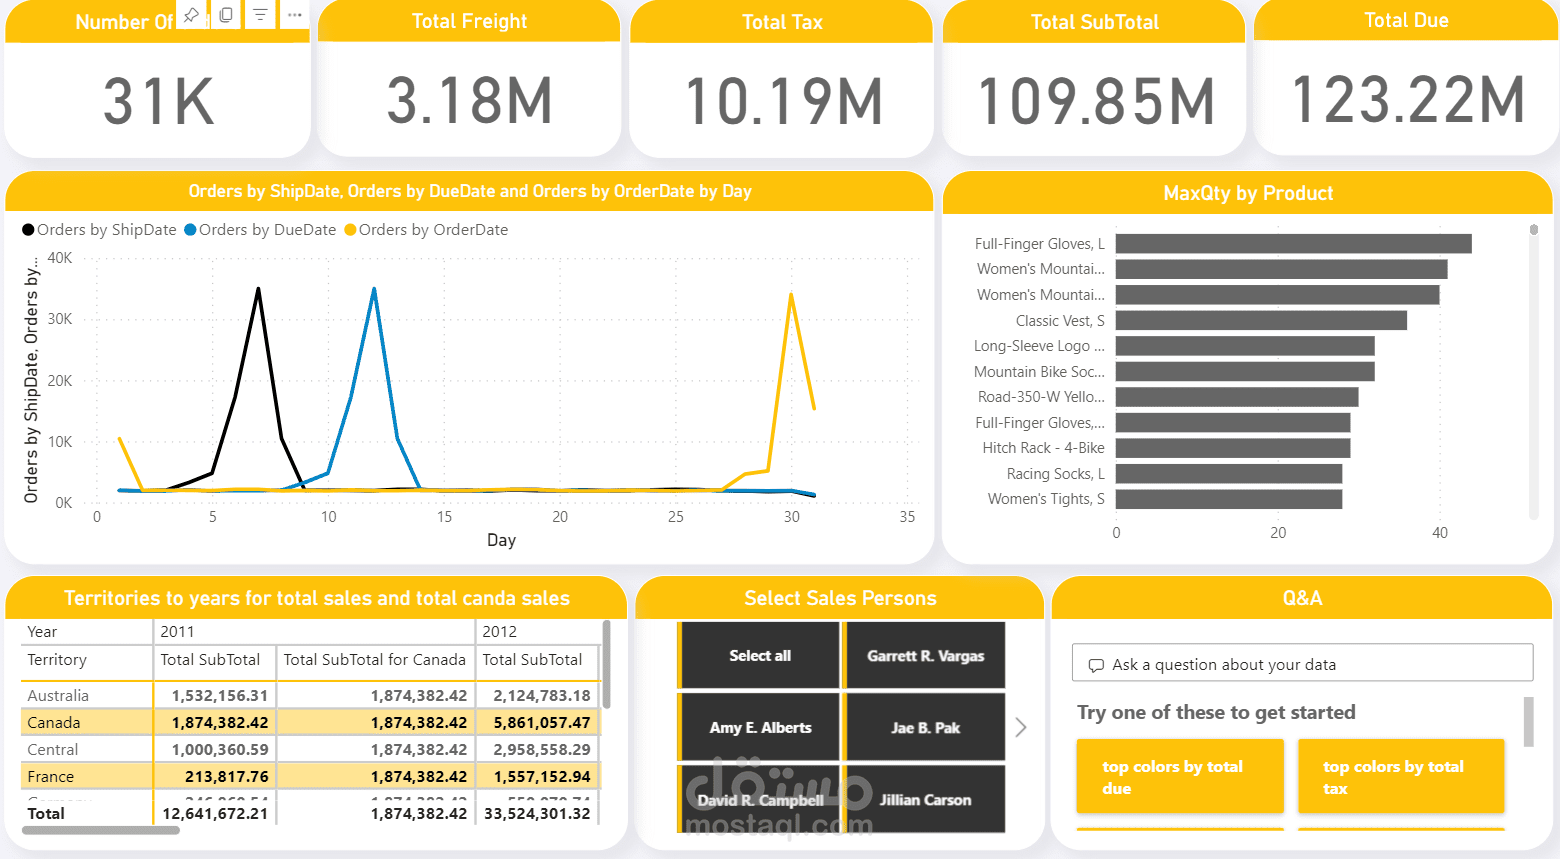
DAX Measures: Essential metrics materialized, like trusty compasses guiding the way. Orders counted, subtotals tallied, taxes calculated, freight costs charted, and grand totals revealed – a treasure trove of insights waiting to be unearthed.
Visual Voyages:
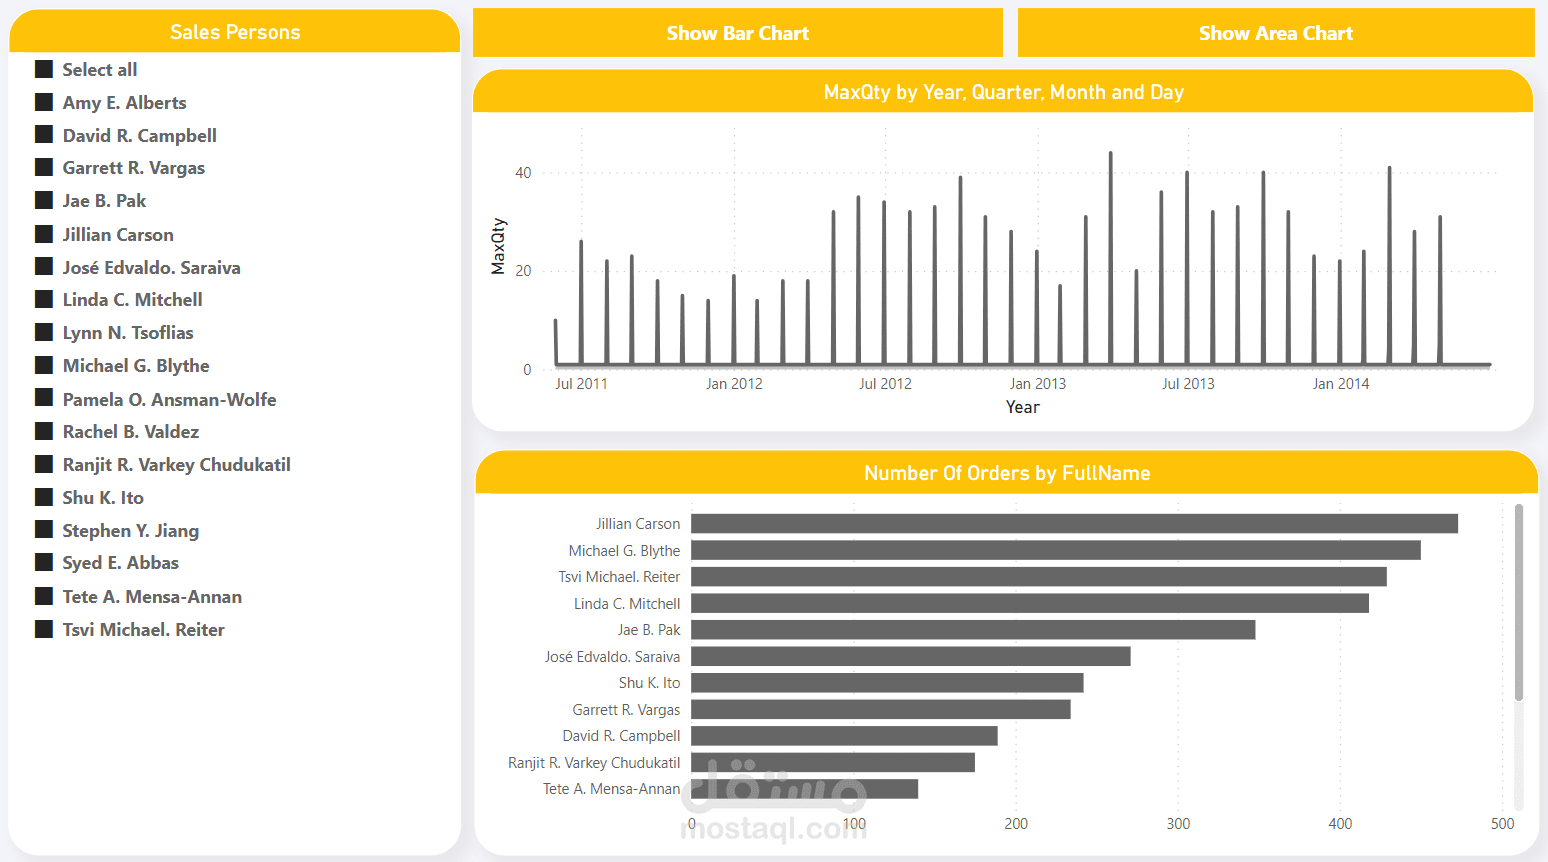
Drill-Down Delights: Plunging into the depths, past surface summaries to granular details. Dates broken down, revealing peaks and valleys within months, weeks, even days. Orders dissected, exposing individual performances within categories, subcategories, and products.
Drill-Through Discoveries: Clicking through layers, uncovering the stories behind the numbers. Customers, territories, salespeople – their contributions brought to light, weaving a tapestry of understanding.
Bookmark Bonanza: No retracing steps! Quick jumps between key views, revisiting crucial insights with a click.
Interactive Explorations:
Slicers for Focus: Sharpening the lens, isolating specific territories, product categories, or date ranges. Tailored analyses, revealing patterns hidden within the larger panorama.
Max Qty per Product: A spotlight on champions, showcasing top performers at a glance. Insights at your fingertips, informing strategic decisions.
Matrix Marvels: A tapestry of trends, territories laid out as rows, years as columns, sales figures filling the canvas. Territorial strengths and weaknesses exposed, guiding resource allocation and marketing campaigns.
Q&A Quests: Ask, and the data shall answer. Natural language queries, like whispered instructions to a trusted guide, unlocking hidden insights with ease.
Beyond the Horizon:
This interactive dashboard is not merely a pretty map; it's a compass, a telescope, and a treasure chest rolled into one. Armed with these insights, AdventureWorks can now:
Make data-driven decisions: No more gut feeling gambles. Informed choices backed by hard numbers, propelling sales growth and profitability.
Track performance: Sales managers transformed into captains, monitoring progress, identifying areas for improvement, and celebrating victories.
Understand customers: Unveiling buying behaviors and product preferences, forging deeper connections and tailoring offerings to meet evolving needs.
Explore further: The data, a boundless ocean, beckons further exploration. New questions will arise, new paths will be charted, and new discoveries await on the ever-evolving landscape of AdventureWorks sales.