Sales Orders
تفاصيل العمل
Project Overview:
visualize and analyze sales data and order information, with the goal of creating an intuitive and
user-friendly dashboard that enables users to identify trends, track progress, and make informed
business decisions based on the data.
Data Source: AdventureWorks
Conductivity Mode: Import
Views:
vw_DimProducts
vw_DimSalesPersons
vw_DimShipMethods
vw_DimStatuses
vw_DimTerritories
vw_FactOrderDetails
DimDates (DAX) containing Year, Month, Day, Month Name, Day Name
Modeling:
Star Schema
Product Hierarchy
Date Hierarchy
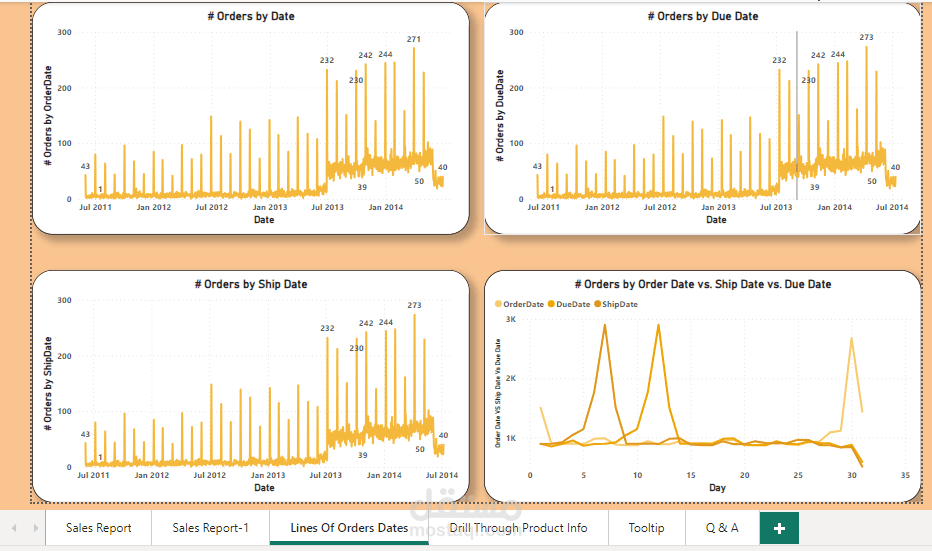
Line Charts vs. Counts (USERELATIONSHIP):
Order Date
Ship Date
Due Date
Measures:
Orders Measure
Total SubTotal Measure
Total Tax Measure
Total Freight Measure
Total Due Measure
DAX Measures Table:
Created a dedicated table housing all essential measures for streamlined reporting.
Hierarchy Enhancement:
Improved analysis depth with advanced Product and Date hierarchies.
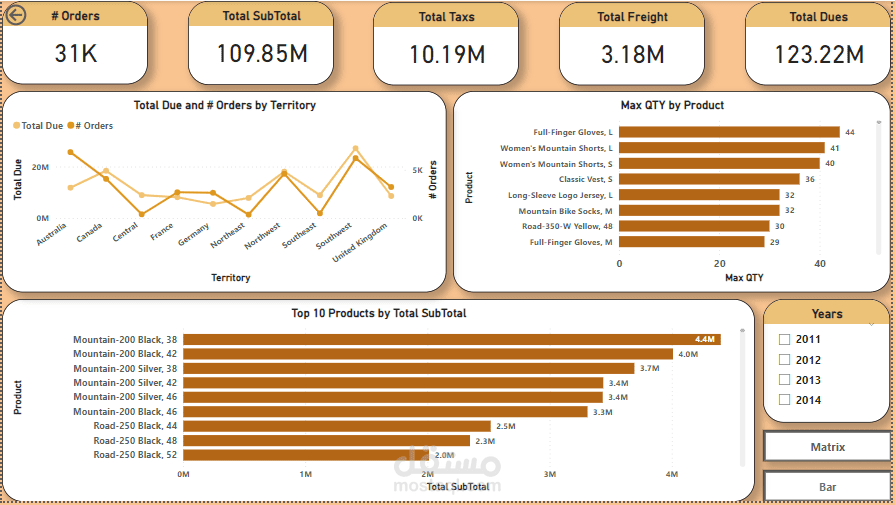
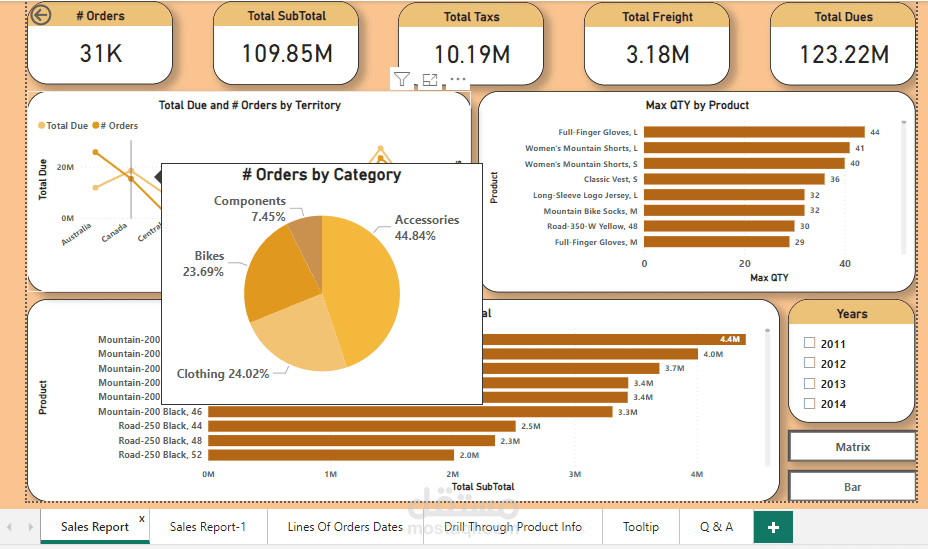
Visualizations:
Designed a visually appealing dashboard featuring:
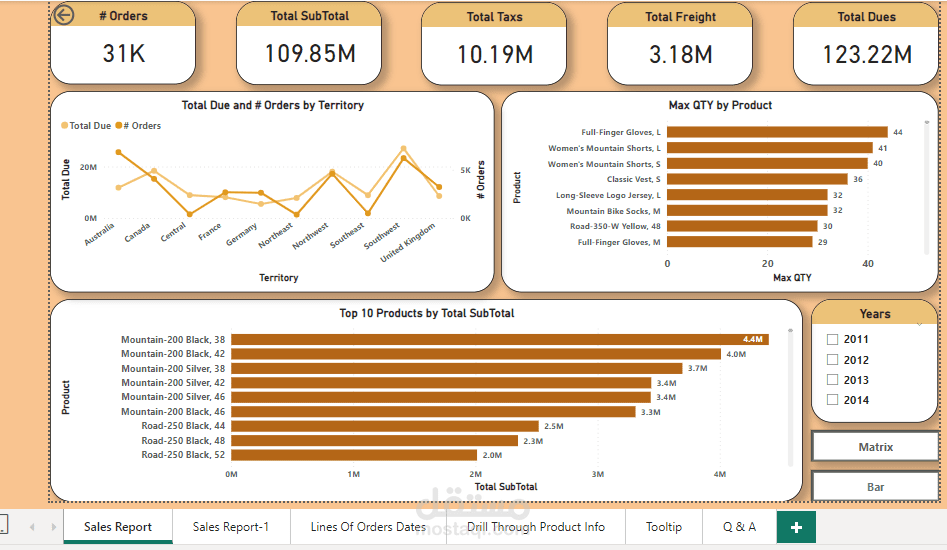
Cards for quick insights.
Drill Down functionality for detailed exploration.
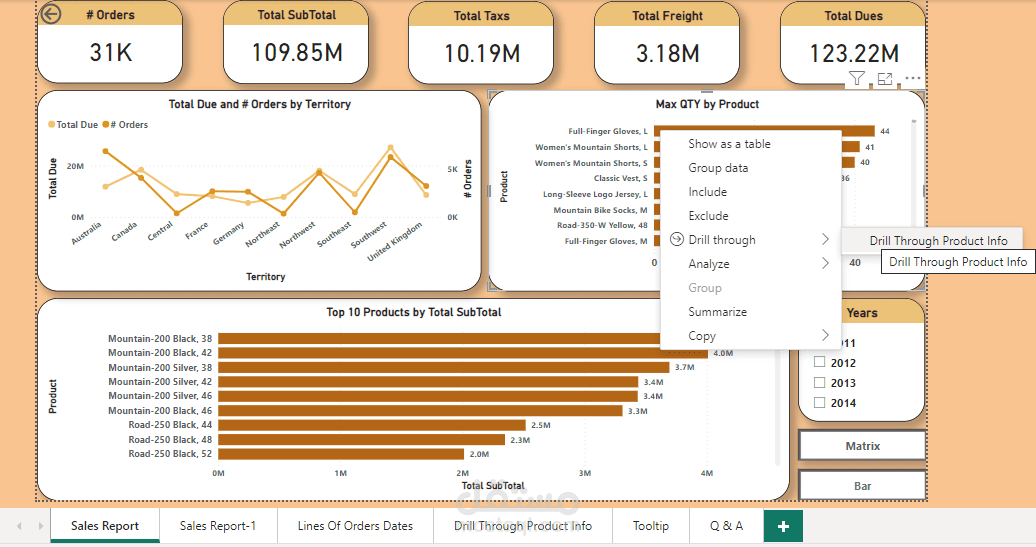
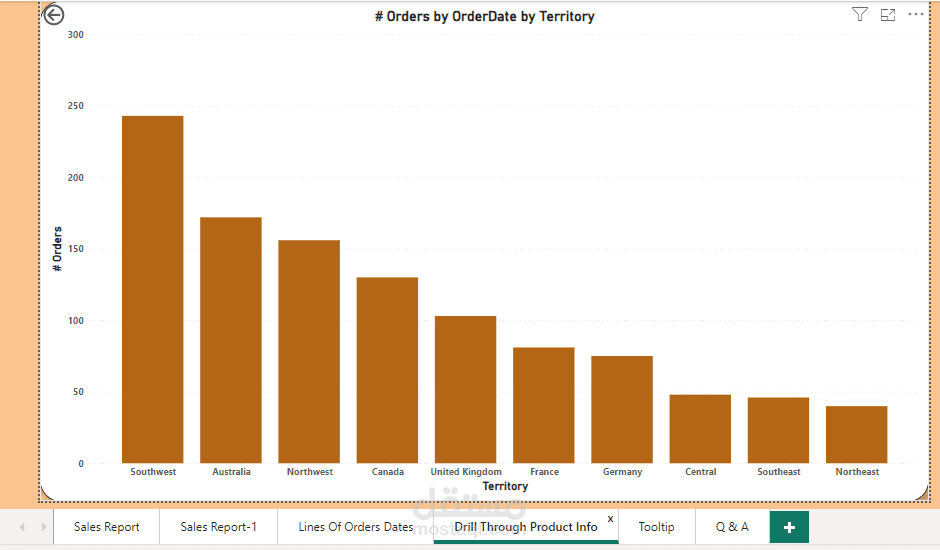
Drill Through options for a deeper dive into specific data points.
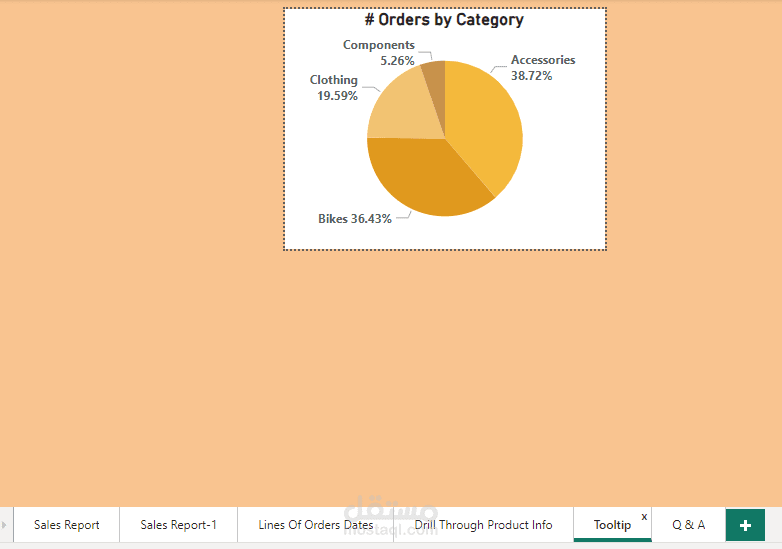
Tooltip page for enhanced user experience.
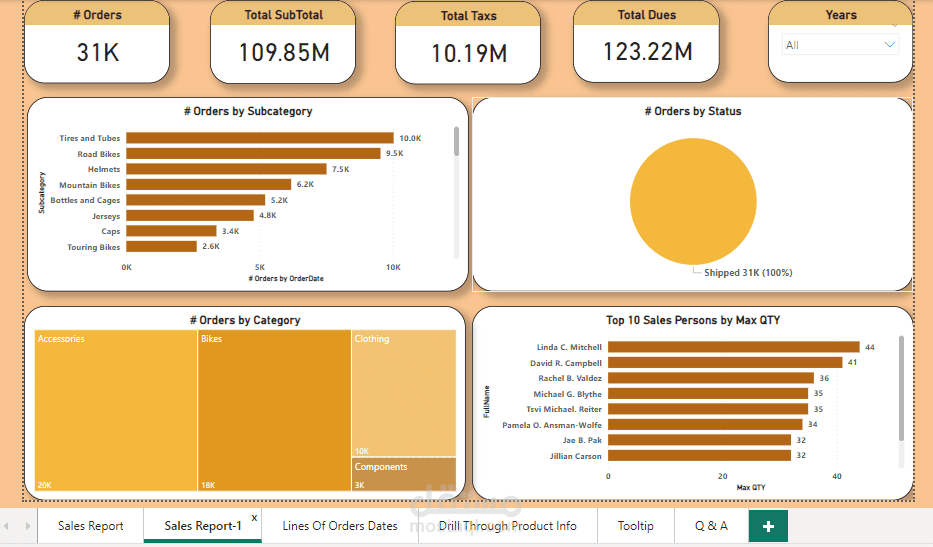
A variety of charts for comprehensive data representation.
Bookmark for easy switching between charts (show and hide)
Slicer implemented on two pages, synced for enhanced user experience
Max Quantity Per Product
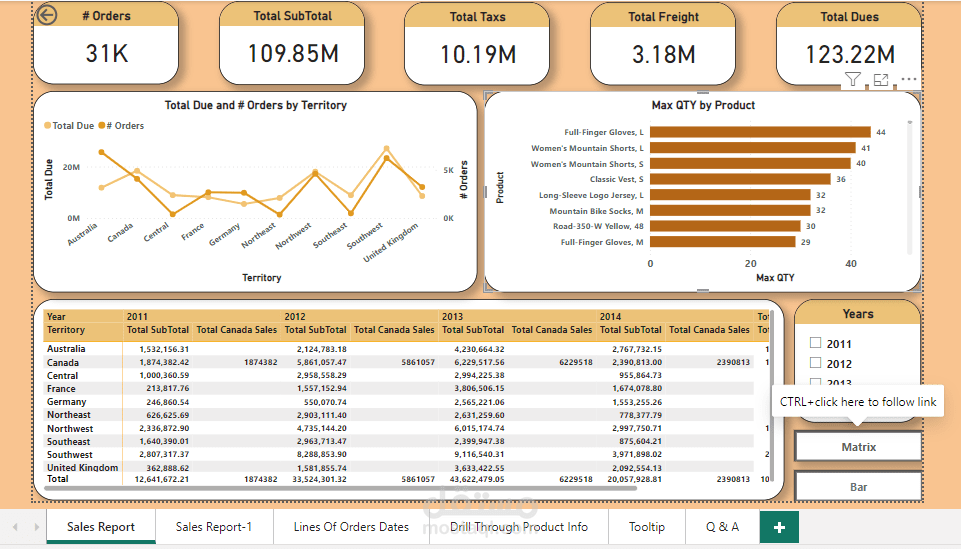
Matrix Chart showcasing Total Sales and Total Canada Sales across Territories and Years
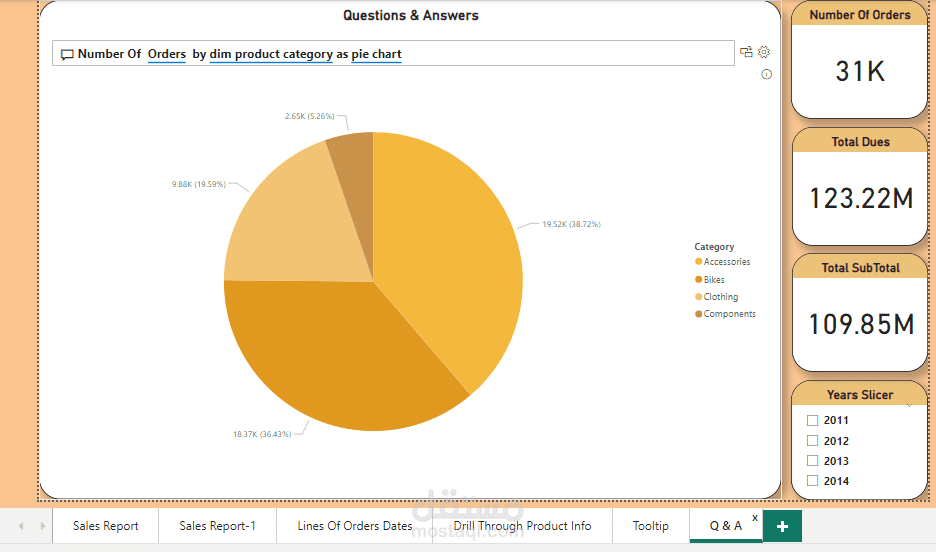
Q&A Chart for intuitive querying