Sales Orders Power BI Report
تفاصيل العمل

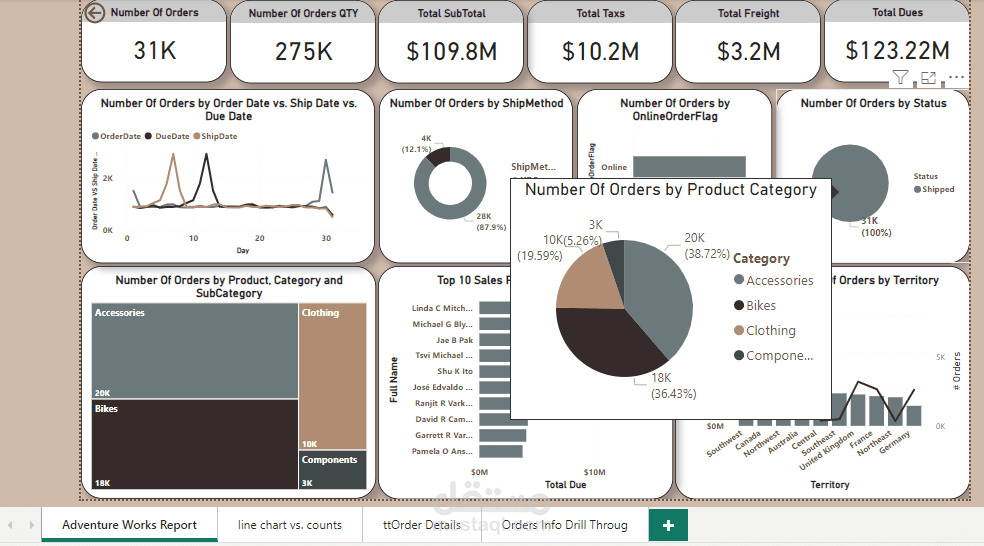
Project Overview:
visualize and analyze sales data and order information, with the goal of creating an intuitive and
user-friendly dashboard that enables users to identify trends, track progress, and make informed
business decisions based on the data.
Dataset Overview:
Utilized AdventureWorks as the source OLTP, employing Conductivity Mode => DirectQuery.
? Data Preparation:
Executed meticulous cleaning and transformation of data for optimal analysis.
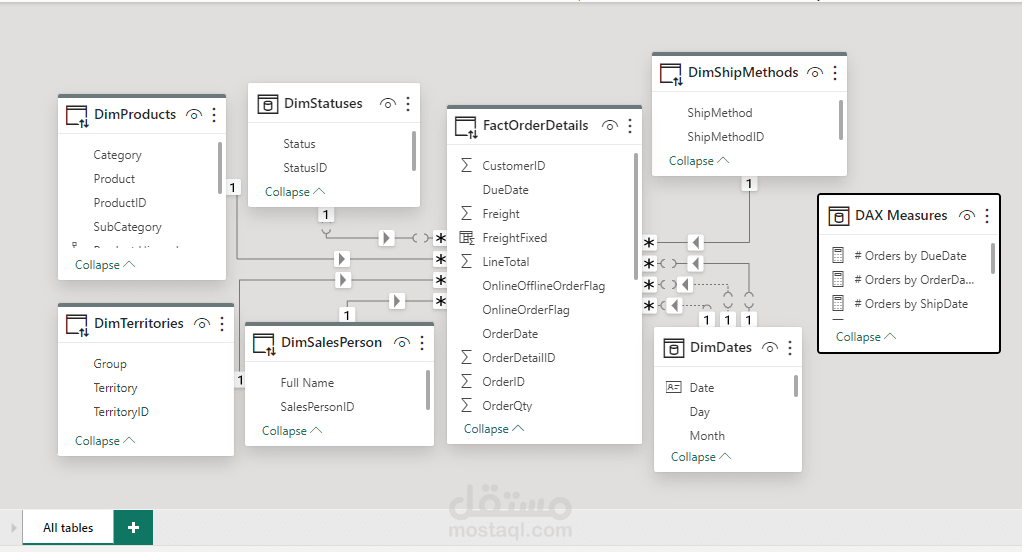
Dimensional Modeling:
Implemented a robust star schema, enhancing data organization and accessibility.
DAX Measures Table:
Created a dedicated table housing all essential measures for streamlined reporting.
Resolved complex calculations, including TotalDue, Tax, and Freight, leveraging the power of DAX.
Crafted DimDates using Power Query, enabling dynamic time-based analysis.
Hierarchy Enhancement:
Improved analysis depth with advanced Product and Date hierarchies.
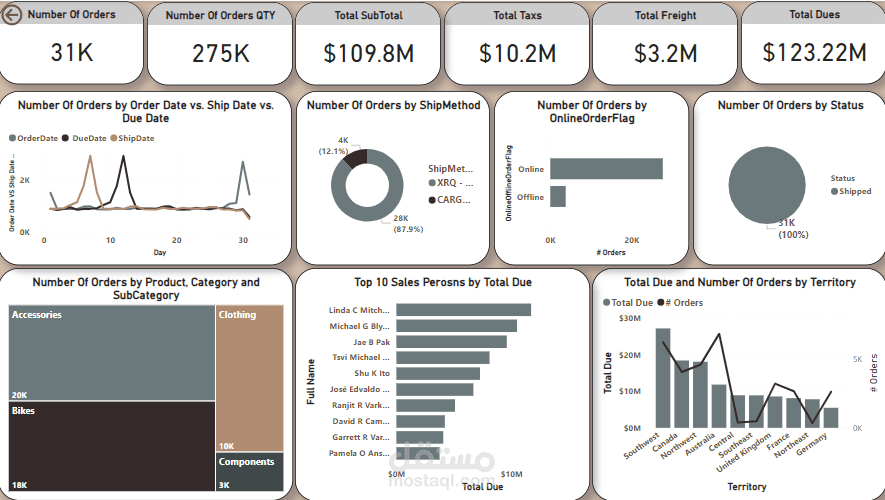
Visualizations:
Designed a visually appealing dashboard featuring:
Cards for quick insights.
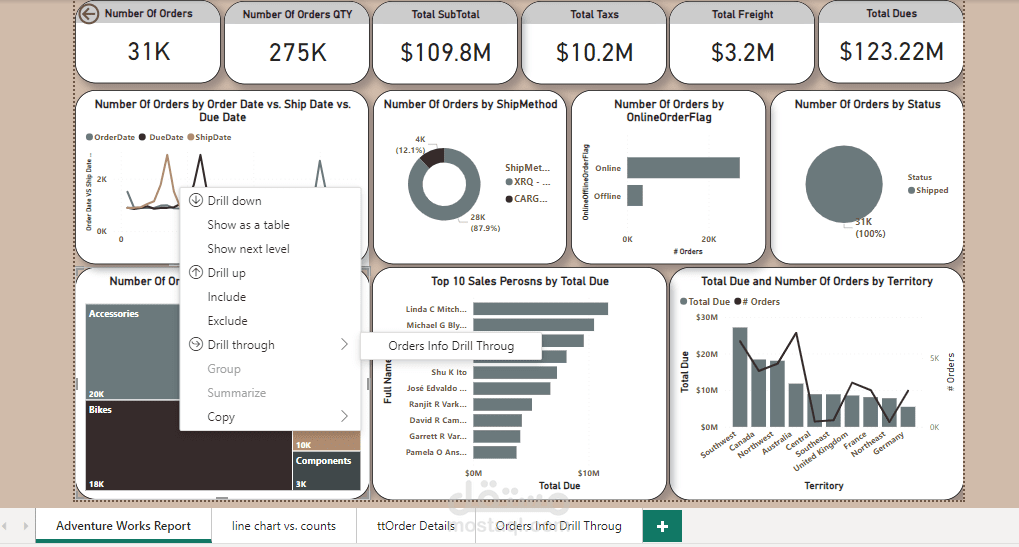
Drill Down functionality for detailed exploration.
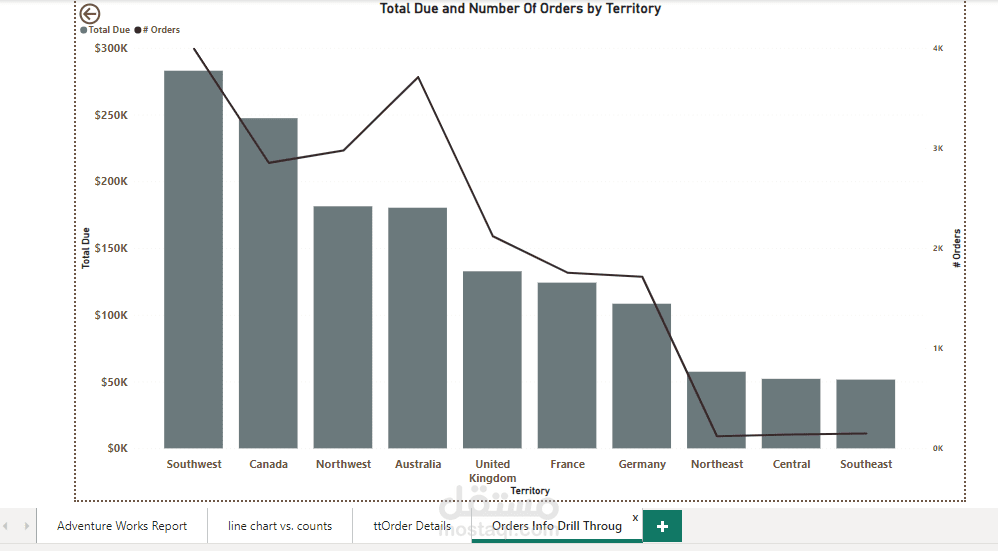
Drill Through options for a deeper dive into specific data points.
Tooltip page for enhanced user experience.
A variety of charts for comprehensive data representation.