Customers Shopping Trends Analysis + Streamlit Dashboard
تفاصيل العمل
Project description
Project: Customers Shopping Trends Analysis + Streamlit Dashboard
About the Dataset: It's about the customers, their information, and their shopping preferences, with the following features:
Project Steps:
1) I got a quick overview of the whole data.
2) Then, I dove deeper into each column to explore the column and see if there were any missing or inconsistent values.
3) I explored the main values of each column.?
4) Finally!! I asked some interesting questions and got spectacular insights in the form of graphs that can increase the number of subscription customers.
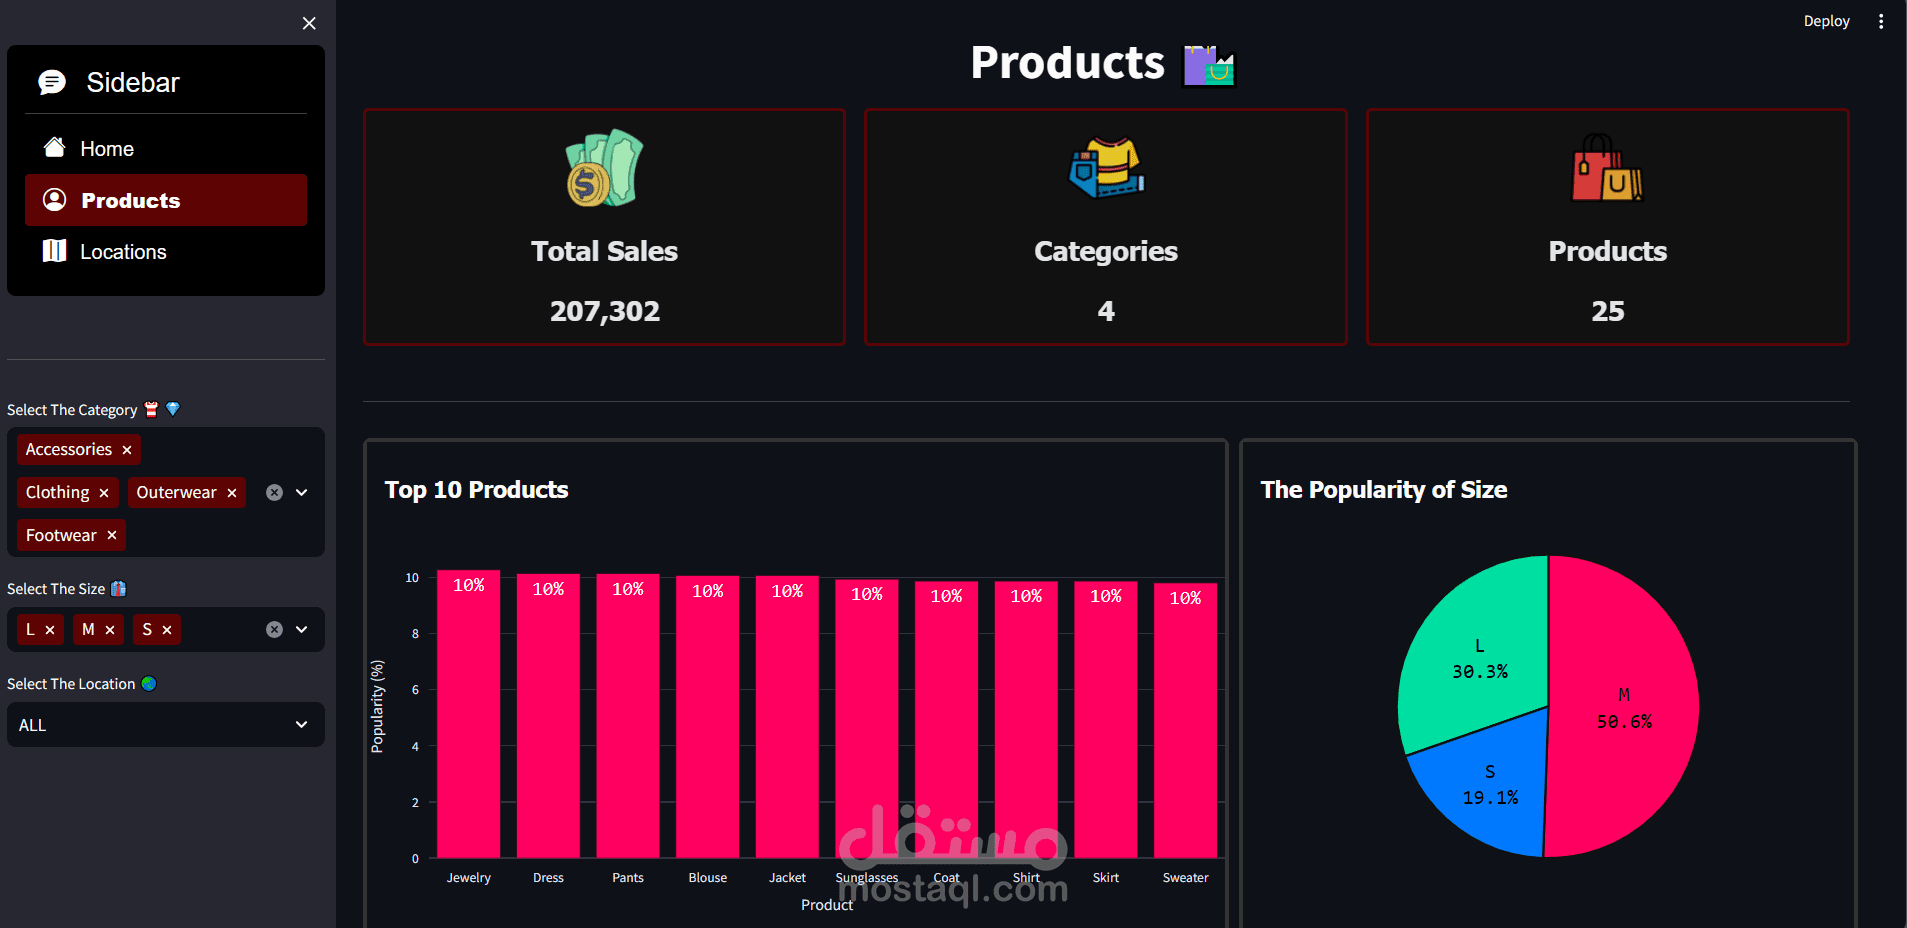
After data exploration, cleaning, and vizualizations using Python (Pandas and Plotly Express), now it's time to build our Streamlit Dashboard .
Dashboard Try to answer the following questions:
1️⃣ What is the total number of our customers??
2️⃣ What is the average rating for our products?
► help you to be aware of the rating firsthand.?
3️⃣ What is the total number of items purchased?!
4️⃣ What is the percentage for each of our sold categories??
► This insight will help you to know most of your products' categories in order to know what the most-sold category is, and the products in this category must exist all the time.
5️⃣ What is the frequency for each gender??
6️⃣ Top 10 Products?
► Of course, you can filter by category to know the top 10 products in each category.
► Please don't hesitate. Go to the dashboard and try it.
7️⃣ The popularity of each category through all seasons??
This will inspire you to improve your sales in each season because you will know when the sales of a specific category increase and when they decrease. From this insight, you can develop strategies to give offers, discounts, or raise the price during a specific season.
8️⃣ Finally, the popularity of categories through the top 5 states?
Of course, there are filters that give you full interactivity while using.