Electronics Store Sales Analysis | Power BI Dashboard
تفاصيل العمل
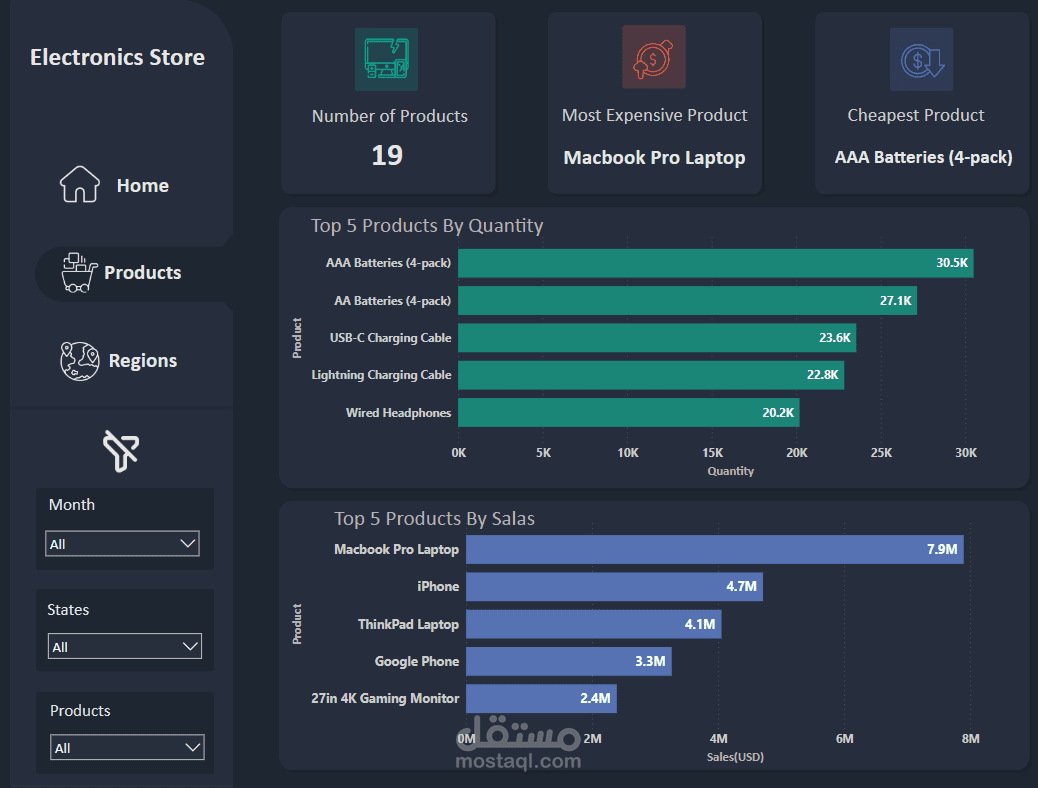
It's about 12 CSV files from the Electronics Store in the USA that belong to one year; each file represents a month.
Merging All Files Together in one Data frame and clean it using python, then explore the data.
# After data exploration and cleaning using Python, we take the cleaned output data and import it into Power BI to build the dashboard