seizure_analysis
تفاصيل العمل
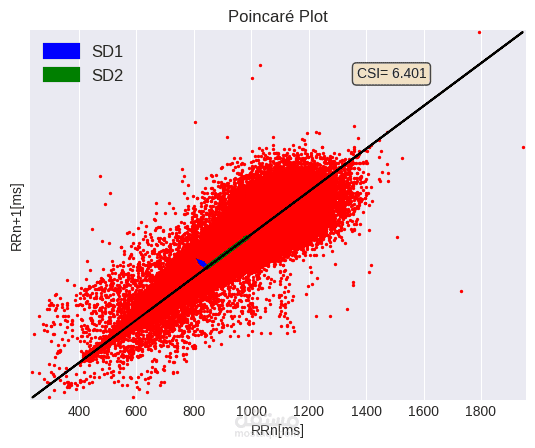
The code analysis the time between two R peaks ,the so-called RR intervals
These RR intervals vary all the time, in healthy people as well as in epileptic patients. Our main
goal is to find specific patterns in the variation of the RR intervals, which only occur if a patient
has an epileptic seizure.
Package task:
Load the data and plot it. What do you generally notice when you look at the data? Describe it shortly.
Implement the following three features: a. Mean b. Standard deviation c. Cardiosympathetic Index (CSI) as described in the given paper
Calculate the features on the given data with a window size of 30 seconds and overlap between windows of 5 seconds
Make plots of the features for all seizures where the data is good enough
Do you think these features are helpful for our main goal, the detection of epileptic seizures? What would you do next?
Prepare a 15-20 Minute presentation with all your outcomes and present it to us during the interview. Choose whatever Presentation-Tool you want (PowerPoint, Keynote, Pen and Paper,...).