Business Sales
تفاصيل العمل
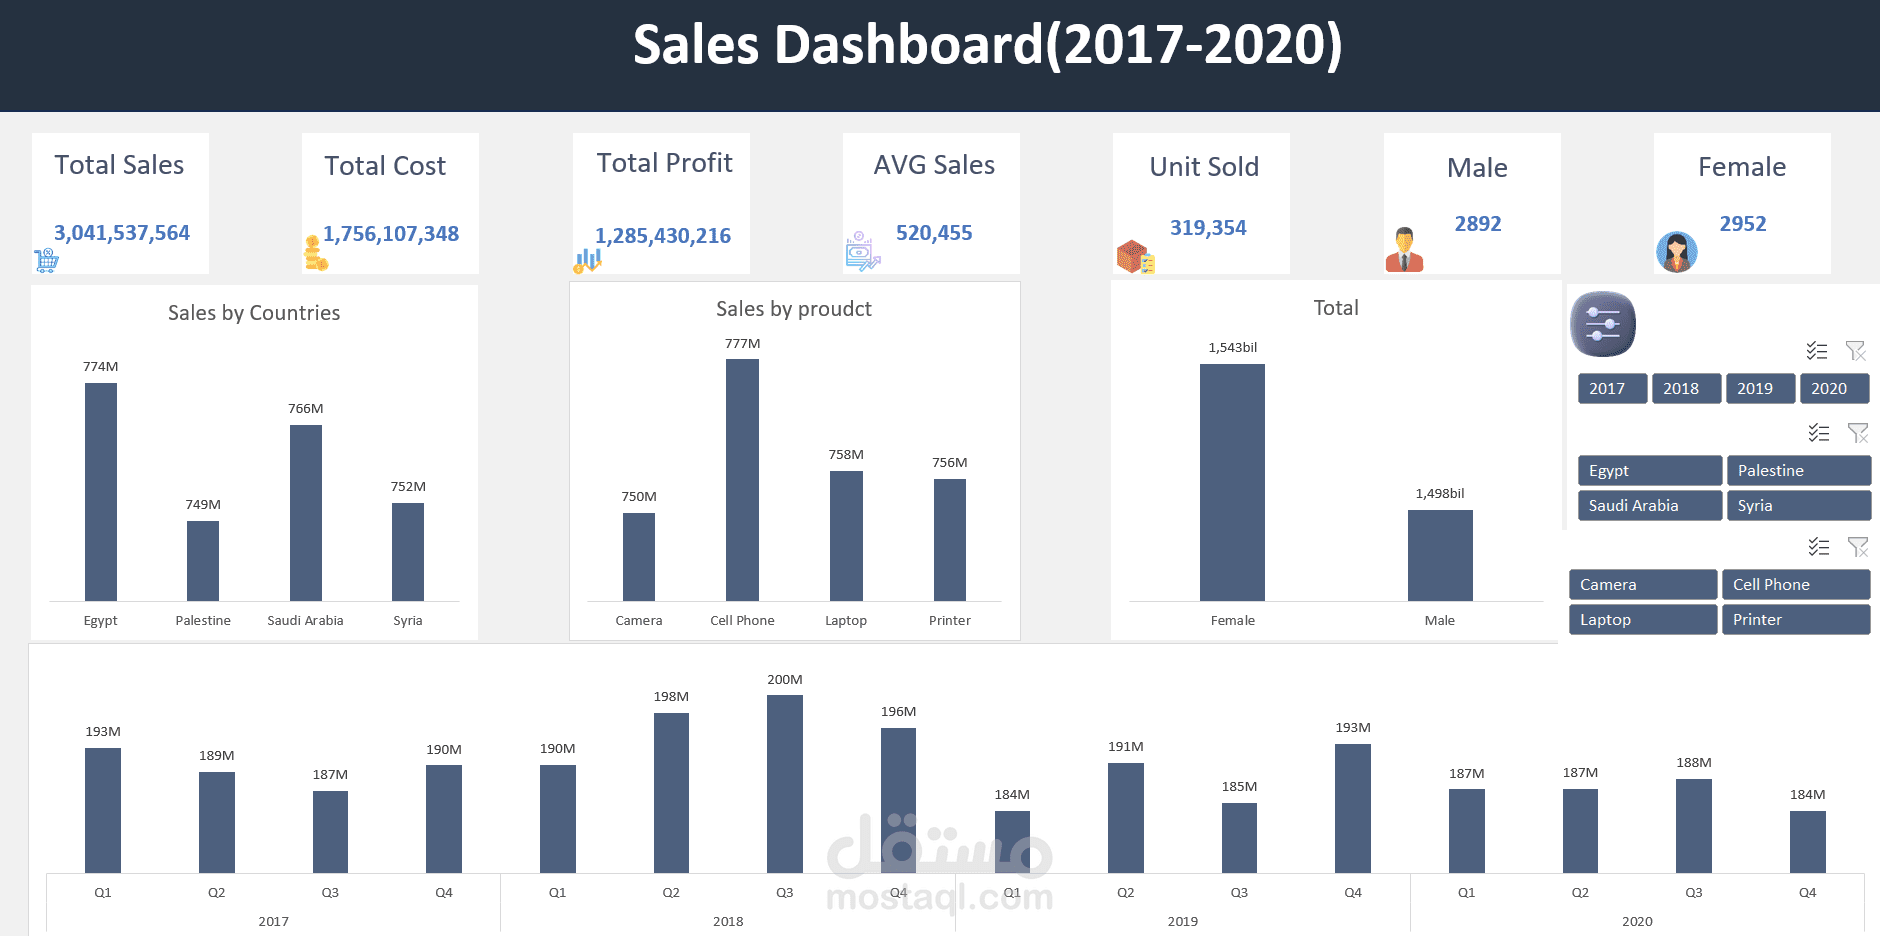
The sales dashboard you sent me shows the total sales, total cost, and total profit of the company from 2017 to 2020. It also shows sales by country, gender, and unit cost.
**Overall Sales Performance**
* Total sales from 2017 to 2020: $3,041,537,564
* Total cost from 2017 to 2020: $1,756,107,348
* Total profit from 2017 to 2020: $1,285,430,216
* Average sales per year: $520,455
**Sales by Country**
* The four countries represented in the dashboard are Egypt, Palestine, Saudi Arabia, and Syria.
* Egypt has the highest total sales over the four years at $774 million.
* Palestine has the lowest total sales over the four years at $749 million.
**Sales by Product**
* The dashboard shows sales for four products: cameras, cell phones, laptops, and printers.
* Cell phones have the highest total sales over the four years at $1.54 billion.
* Cameras have the second highest total sales over the four years at $1 billion.
**Sales by Gender**
* Almost equal sales were made to both genders in the four years.
* Total sales to males: $2,892,347,822
* Total sales to females: $2,952,189,742
**Year over Year Sales**
* It is difficult to say definitively how sales changed year over year because the data is not presented in a way that allows for easy comparison.
* However, there appears to be a slight increase in sales from 2017 to 2020.
**Limitations of the Dashboard**
* The dashboard does not show the cost of goods sold (COGS), which is an important metric for profitability analysis.
* The dashboard does not show sales by region or by product category.
* It is not clear how sales are broken down by quarter.
I hope this analysis is helpful!