power bi project
تفاصيل العمل
Power BI Project Overview
**Project Title:** Enhanced Sales Analysis and Reporting Solution
**Project Description:**
Are you seeking an advanced Power BI project that can transform your sales data into a powerful analytical tool? Look no further! This project offers a comprehensive analysis and reporting solution for your sales data. Here's a breakdown of what this Power BI project includes:
**Conductivity Mode: DirectQuery**
**Tables and Views:**
- Sales.SalesOrderHeader
- Sales.SalesOrderDetail
- Sales.vSalesPerson (view)
- Sales.SalesTerritory
- Purchasing.ShipMethod
- Production.Product
- Production.ProductSubcategory
- Production.ProductCategory
**Data Transformation and Cleanup:**
- Renaming tables and columns for clarity and consistency.
- Eliminating unused columns to streamline data processing.
**Table Merge Using M Language:**
Combining the Production.Product, Production.ProductSubcategory, and Production.ProductCategory tables into a unified table for improved data management. This merged table contains ProductID, Product, SubCategory, and Category.
**Advanced Calculations:**
Solving for TotalDue, Tax, and Freight either through Power Query or DAX, ensuring accurate financial insights.
**Data Modeling:**
- Implementing a Star Schema for optimized data relationships.
- Creating a Product Hierarchy for a more granular view of your product data.
**Visualizations:**
Leveraging a variety of visualizations powered by DAX measures and Power BI's interactive features:
- Drill Down and Drill Through capabilities for in-depth analysis.
- Tooltip page for dynamic insights.
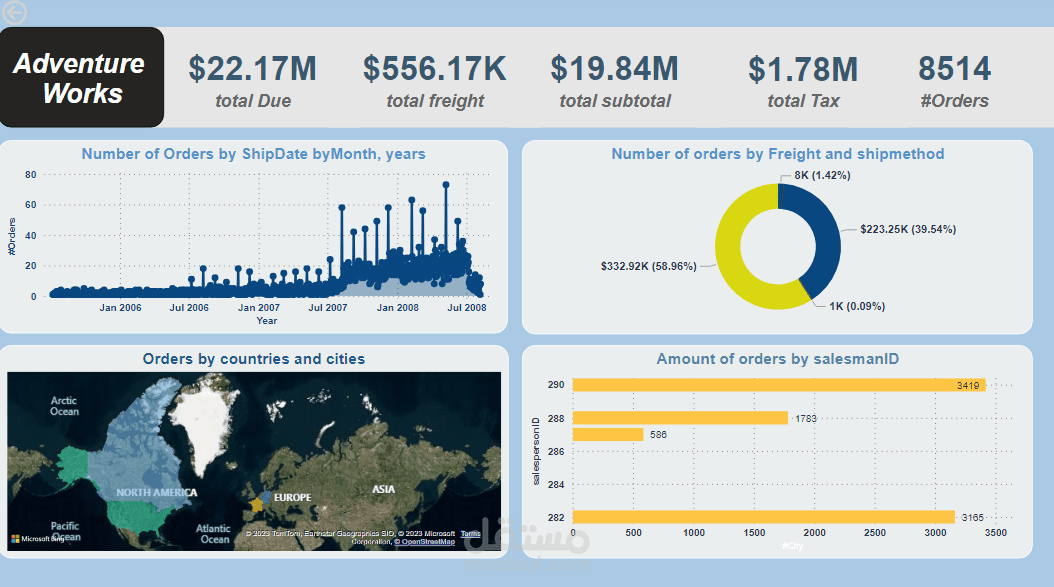
- Visual Cards for key metrics:
- # Orders
- Total SubTotal
- Total Tax
- Total Freight
- Total Due
**Line Charts vs. Counts with USERELATIONSHIP:**
- Analyzing data by key date fields (Order Date, Ship Date, Due Date).
**Model Enhancements:**
- Transforming the model into a Star Schema for improved performance and usability.
**Measures:**
Creating a set of powerful DAX measures for comprehensive analysis:
- Orders Measure
- Total SubTotal Measure
- Total Tax Measure
- Total Freight Measure
- Total Due Measure
- Qty
**Visual Dashboards:**
- Orders by Order Date vs. Ship Date vs. Due Date
- Orders by Status
- Orders by Ship Method
- Orders by Category, SubCategory, Product
- Orders by Flag (Online/Offline)
- Orders vs. Total Due by Territory
- Top 10 Sales Persons (Filterable by # Orders or Total Amount)
This Power BI project aims to equip you with a robust sales analysis and reporting tool, enabling you to make data-driven decisions and gain actionable insights from your sales data. If you're ready to take your data analysis to the next level, contact us today to get started!