Transforming data
تفاصيل العمل
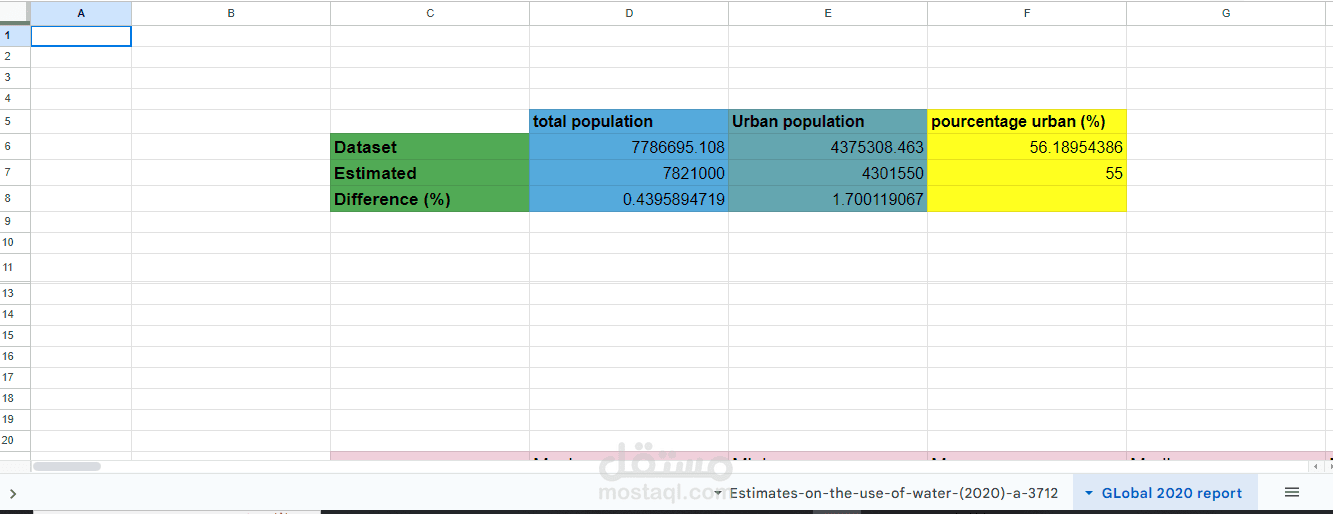
integrated project on access to drinking water:
Becoming Familiar with the Dataset
The dataset covers the years 2000-2020, but not every year is represented for each country. On average, there are about 15 years between data entries per country.
Investigating Year Representation
The distribution of years is positively skewed, with most years clustered around 2000-2010 and fewer years approaching 2020.
Investigating Annual Rates of Change (ARC)
Calculated the annual rate of change for access to basic water services for national, rural, and urban populations. Found that rural areas had the highest average increase.
Investigating Access by Area
Looked at the number of countries with full access, no change, decrease, and increase in access. Found that more countries increased access in rural areas.
Investigating Access by Region
Added region data and found Sub-Saharan Africa had the lowest average national and rural ARC, meaning slower progress in increasing access.
In summary, the analysis showed that rural areas saw the greatest improvement in access to basic water services across the 2000-2020 period. However, progress was slowest in Sub-Saharan Africa, highlighting it as the region in greatest need of intervention to reach the UN Sustainable Development Goal of universal access to safe drinking water.