Airlines Delays
تفاصيل العمل
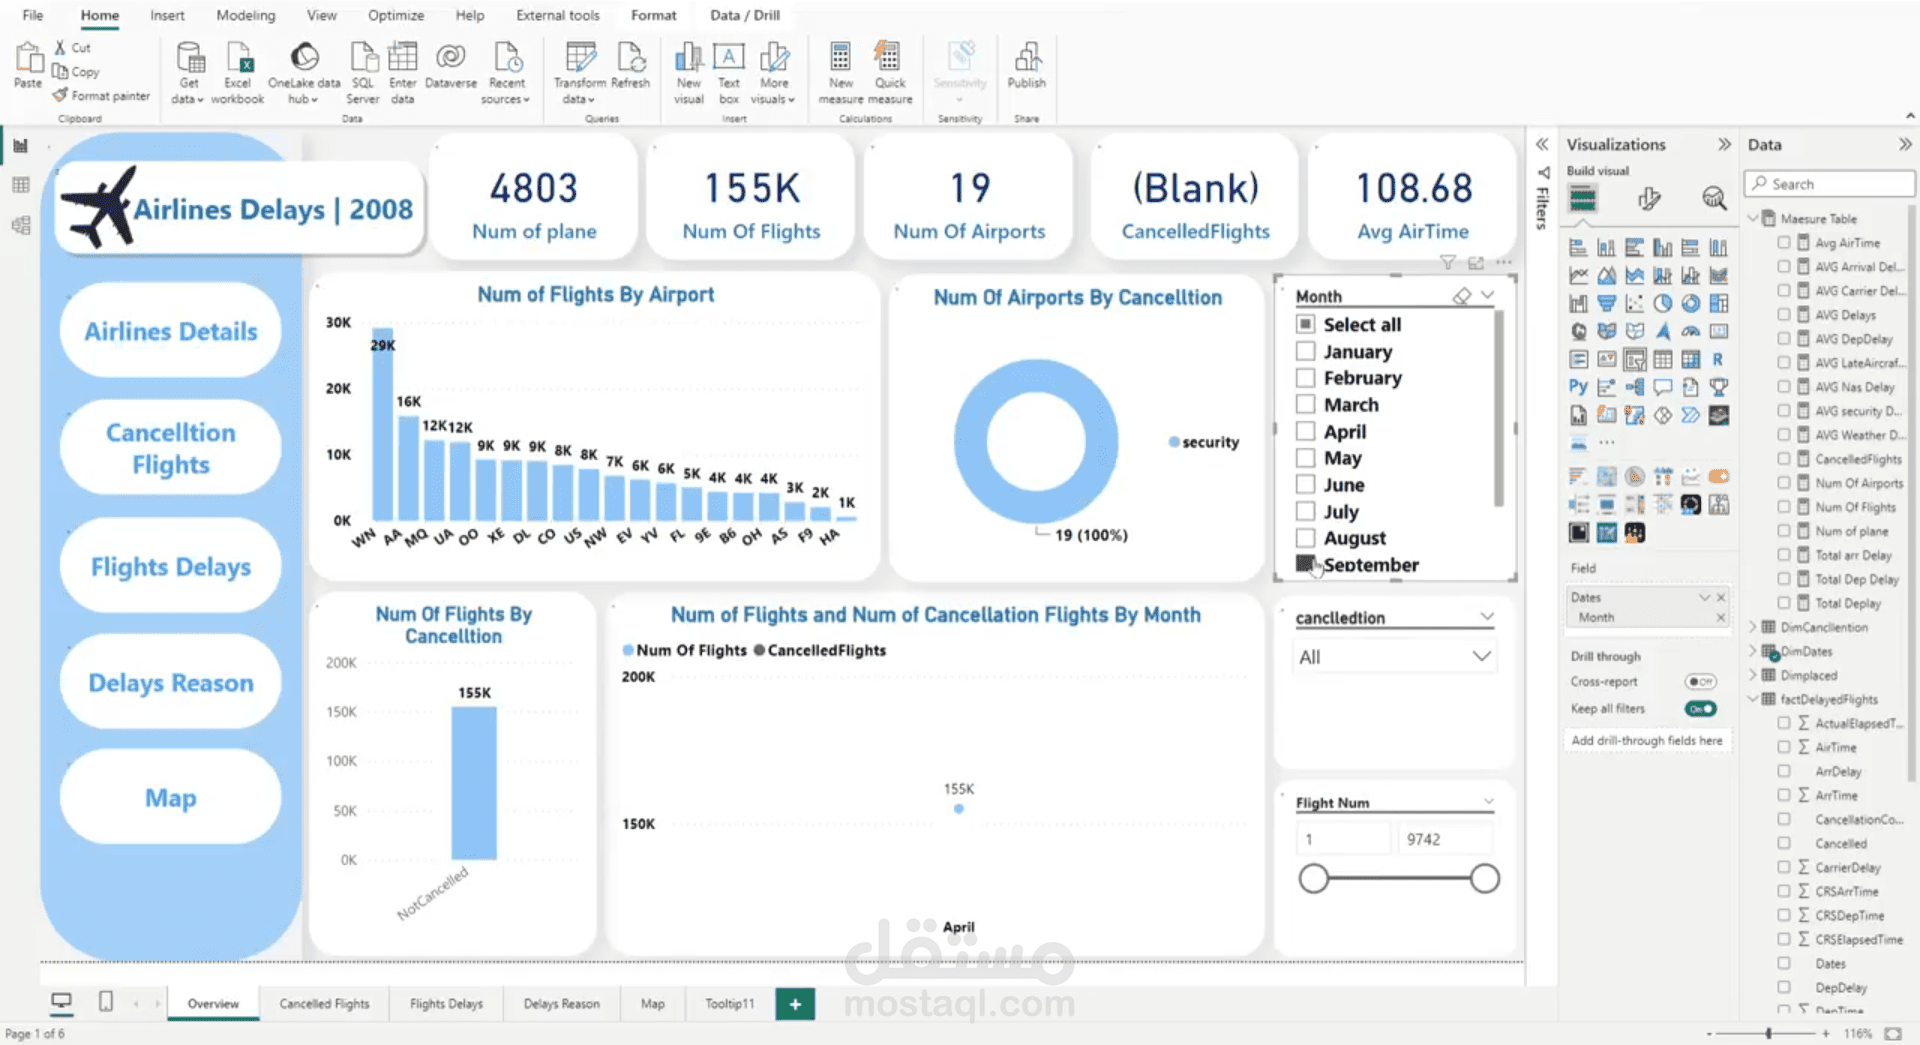
I'm excited to share my recent Power BI dashboard using a project, US Airlines delays in 2008 report! ️
I analysed this dataset from Kaggle to uncover valuable insights into Airline's performance.
From one table (fact) I extract 2 dimension tables
-DimCancellation
-DimDate
- Managed to import data from CSV file
- Transformed data by dimensional modelling to get a star schema.
- created a DAX table that contains all measures.
- Created multiple visualizations to represent specific details about the business.