student_scores_ana;lysis with python
تفاصيل العمل
Analyzing student scores with Python can involve various tasks, such as loading and processing data, performing statistical analysis, and visualizing the results. Here's a step-by-step guide on how to perform a basic analysis of student scores using Python:
Data Preparation:
Start by collecting or obtaining your student score data. This data can be in various formats, such as CSV, Excel, or a database.
Data Loading:
Use a library like Pandas to load your data into a DataFrame.
python
Copy code
import pandas as pd
# Load your data
df = pd.read_csv('student_scores.csv')
Data Exploration:
Check the first few rows of your dataset to understand its structure.
python
Copy code
# Display the first few rows of the DataFrame
print(df.head())
Basic Statistics:
Use Pandas to calculate basic statistics, such as mean, median, and standard deviation.
python
Copy code
# Calculate basic statistics
mean_score = df['Score'].mean()
median_score = df['Score'].median()
std_deviation = df['Score'].std()
print(f"Mean Score: {mean_score}")
print(f"Median Score: {median_score}")
print(f"Standard Deviation: {std_deviation}")
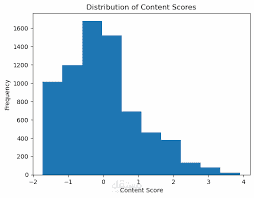
Data Visualization:
Visualize the data using libraries like Matplotlib or Seaborn. You can create histograms, bar plots, and scatter plots to explore the data further.
python
Copy code
import matplotlib.pyplot as plt
import seaborn as sns
# Create a histogram
plt.figure(figsize=(8, 6))
sns.histplot(df['Score'], bins=10, kde=True)
plt.xlabel('Score')
plt.ylabel('Frequency')
plt.title('Distribution of Student Scores')
plt.show()
Data Analysis:
Depending on your research questions or objectives, you can perform various analyses. For example, you can calculate the pass rate, perform hypothesis tests, or analyze the relationship between different variables.
python
Copy code
# Calculate pass rate (assuming a passing score is 50)
passing_score = 50
pass_rate = (df['Score'] >= passing_score).mean() * 100
print(f"Pass Rate: {pass_rate}%")
# Perform a t-test to compare scores between two groups, if applicable
from scipy import stats
group1_scores = df[df['Group'] == 'Group1']['Score']
group2_scores = df[df['Group'] == 'Group2']['Score']
t_stat, p_value = stats.ttest_ind(group1_scores, group2_scores)
print(f"T-Stat: {t_stat}")
print(f"P-Value: {p_value}")
Conclusion:
Summarize your findings and insights from the analysis.
This is a basic example of how to perform a student scores analysis with Python. Depending on your specific dataset and research questions, you may need to use more advanced statistical techniques and data visualization methods. Additionally, you can use machine learning models for predictive analysis if your dataset includes more features and targets.