Sales Products Dashboard2019-2020
تفاصيل العمل
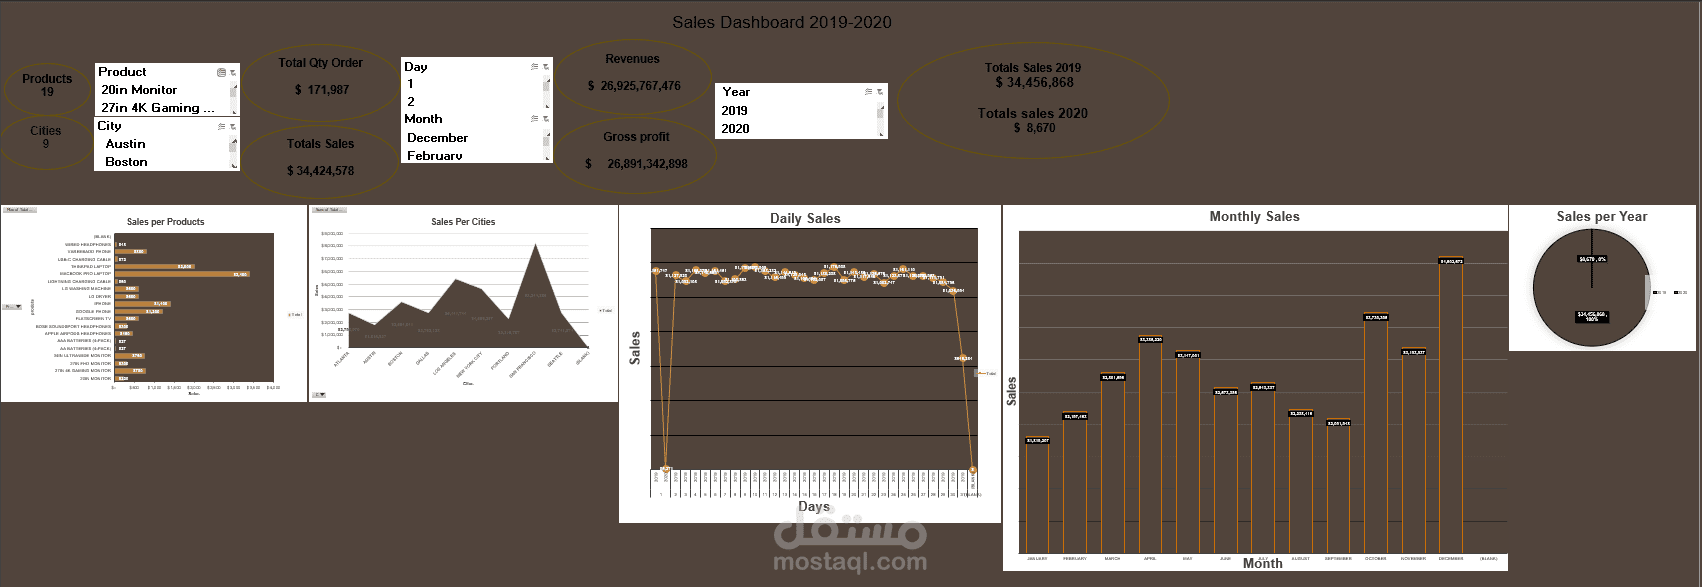
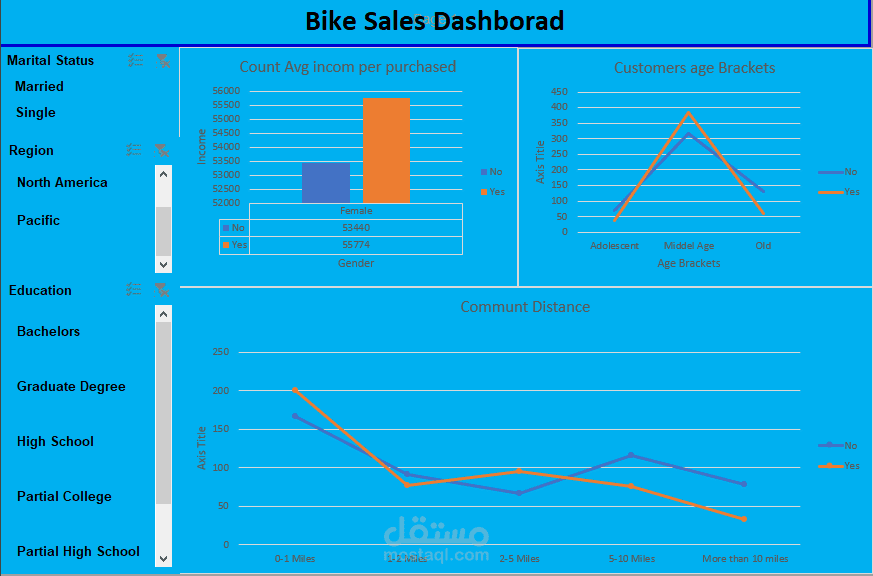
Analyze sales data to identify trends, top-selling products, and revenue metrics for business decision-making.
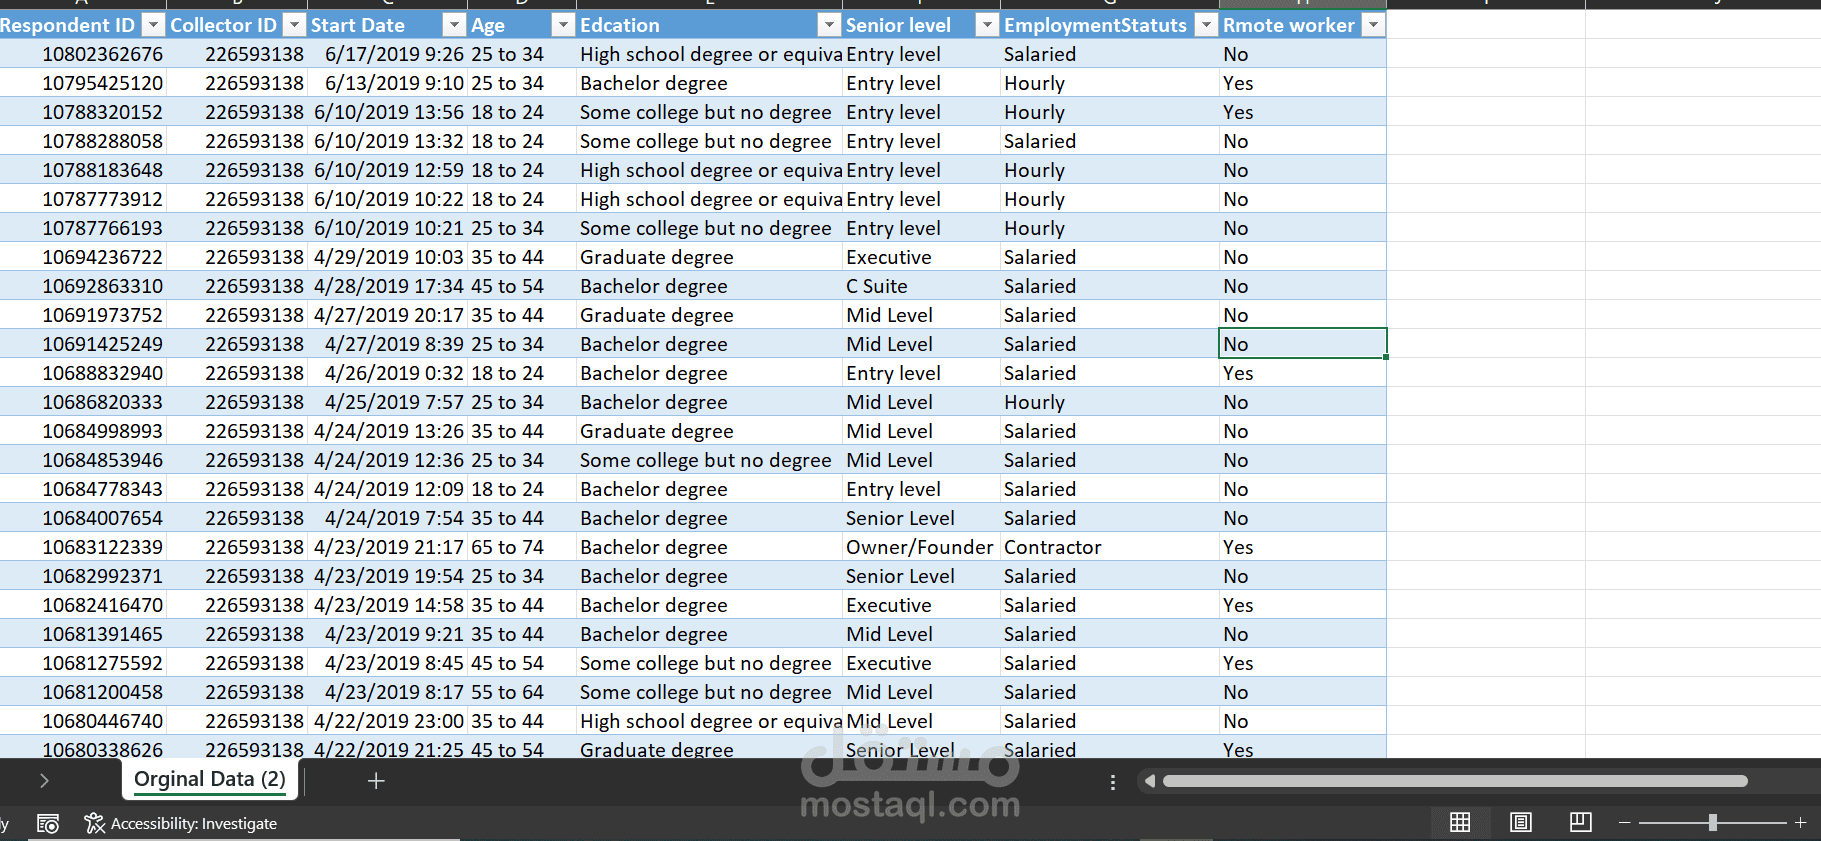
firstly, i made qiuq analysis routine with #MicrosoftExcel and i found 264 duplicate and removed hour column because making Nosie data i have nineteen products, nine Cities, sample data for two years just 2019-2020.Totals sales of each product already been calculated. After carefully what is require from me in task description the want sales over times and metric revenues. so i extract from Order-date three columns day, month, year. and from totals sales i made two columns metrics revenue and profit across.
Insights that i got from dashboar
The best sales product is MacBook Pro Laptop with total sales$ 3,400
The best City with high sales among the Cities is San Francisco with total sales $ 8,244,886 .
The best monthly is in December with total sales $ 4,602,672
Years Sum of Total Sales 2019 $ 34,456,868 & 2020 $ 8,670
Totals sales for two years $ 34,465,538
Recommendations
i noticed the December has high selling ret we can make offer to give another products for free with products does not have high sales and add part of price of it to original product.