Data analysis using microsoft excel and designing dashboard
تفاصيل العمل
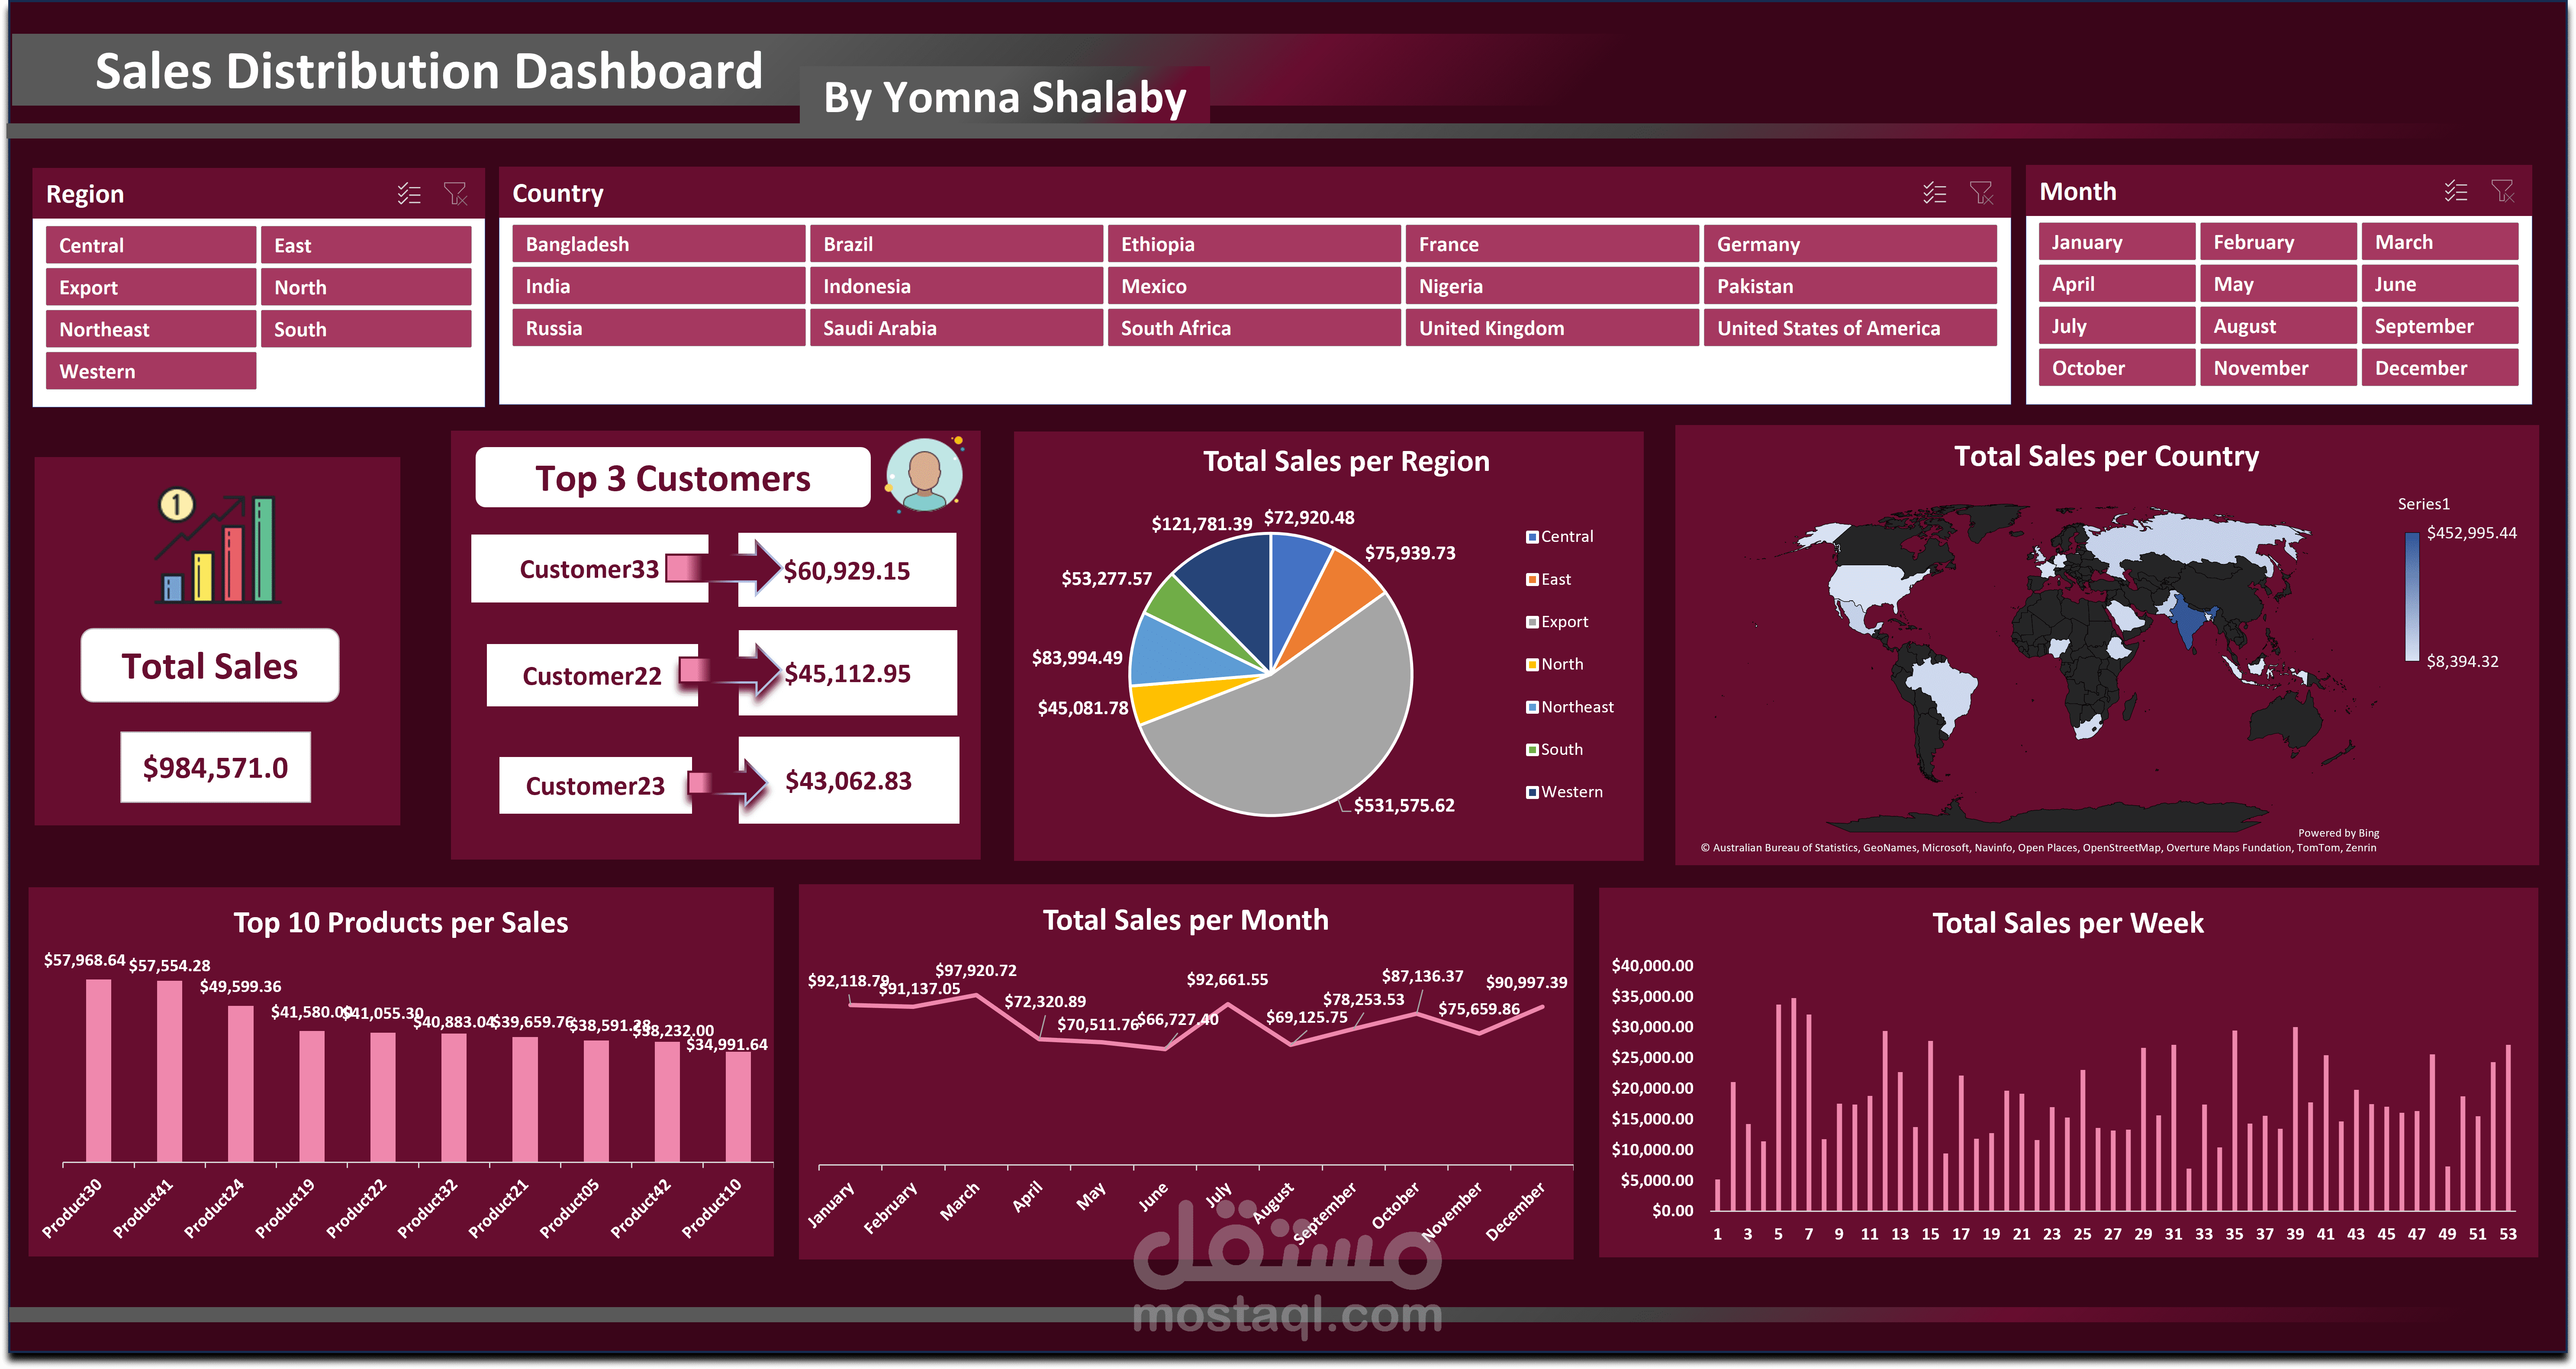
A project was implemented to analyze data for a major international company that has branches in several countries in different regions around the world. A dashboard was designed to easily display and show the total sales and to clarify the sales over each week and each month. It also shows the total sales for each region and for each country. The top 3 customers in the total purchase price and the top 10 products that achieved a total return in sales were also shown, with several slicers being placed regarding the region, country, and months of the year.