Sales Data Analysis using Power BI
تفاصيل العمل
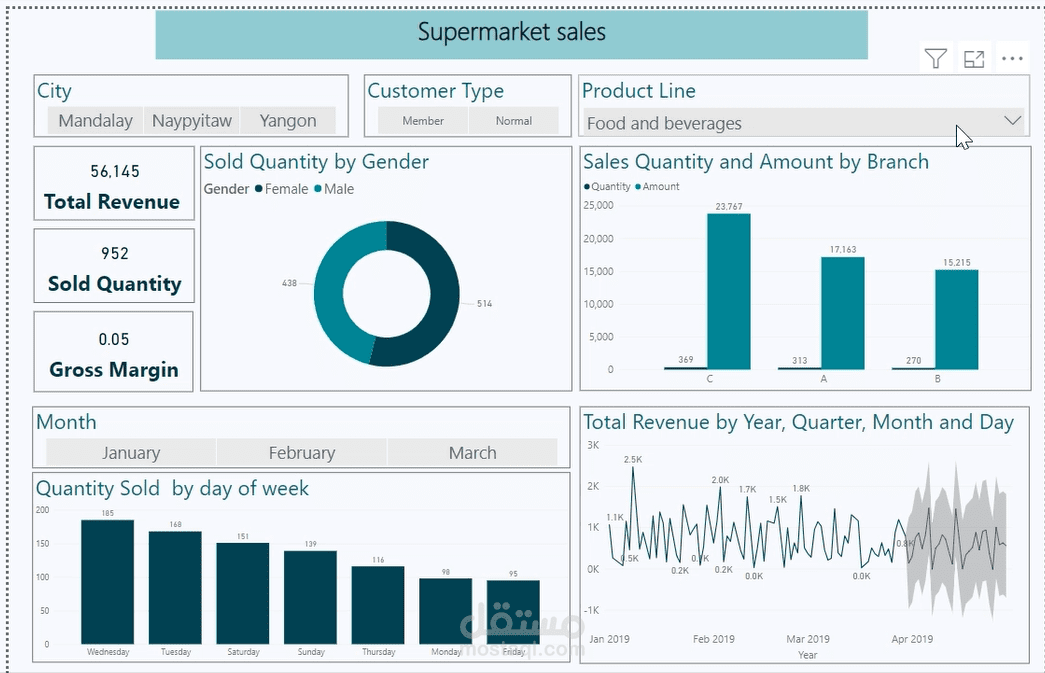
I have created this dashboard using Microsoft Power BI.
In this interactive dashboard, I have used data from the Kaggle website, the link to the data is at the end of this post.
This dashboard helps decision-makers in many areas, as it can help with the following:
1- Follow-up of sales for each branch.
2- Forecast sales for the coming months.
3- Follow-up of sales on weekdays, which helps the decision-maker to make offers for some days to increase sales during that day.
4- It also enables the decision-maker to make decisions related to the branch and follow up on the branch’s performance.
Data link:
# data visualization # data analysis
#dataanalysis #datavisualization #microsoftpowerbi