Adventure Works Report
تفاصيل العمل
Power BI is one of Microsoft tools used to extract, transform & load data to represent useful insights so that business owners can make decisions regarding their business.
Now, I'm happy to share one of my reports I created using AdventureWorks Microsoft Dataset.
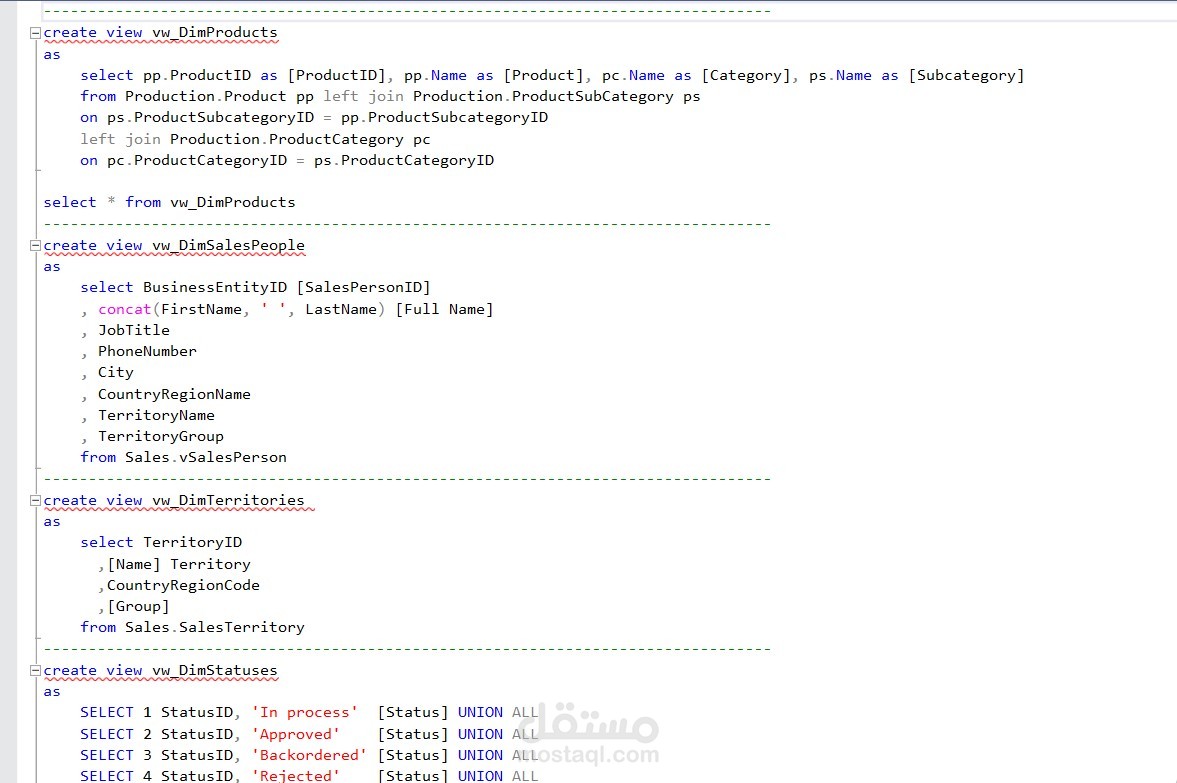
- I've managed to extract data from Microsoft SQl Server Database Views
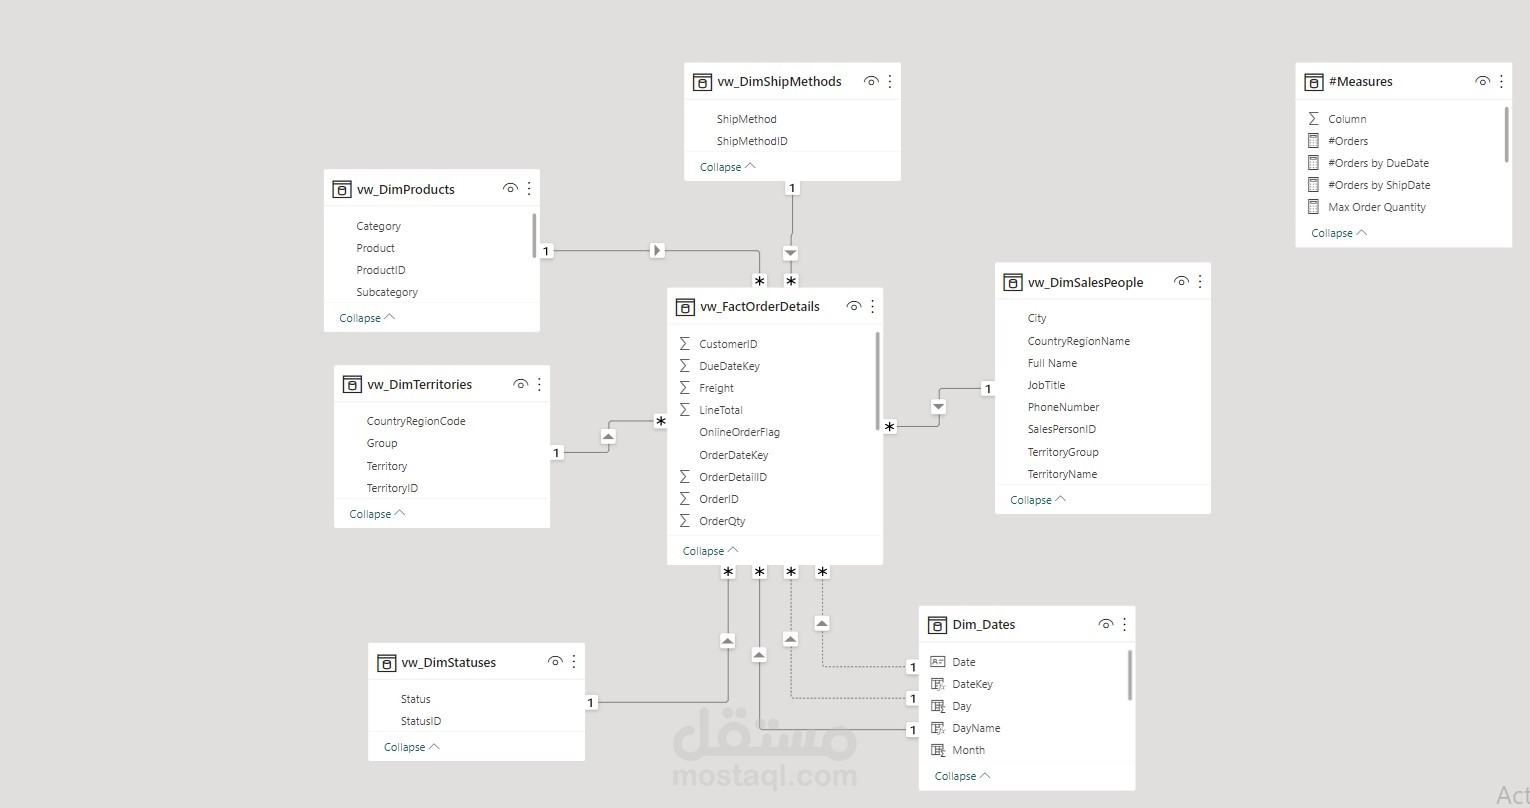
- Transformed data by dimensional modelling to get a star schema. Hence, established a better & high performance rate.
- Created a date dimension table by DAX to compare data among years, months, etc.
- Created multiple visualizations to represent specific details about the business.
- Also, I've given the ability for the business owner to switch between two types of charts by creating a bookmark, to make it as simple as possible for him to view data in multiple ways.
- Since the products have a lot of details, I also created a drill through page so that whenever the business owner wants to check every product's name, category, subcategory and max quantity ordered to identify the bestselling products, he'll easily can do this.
- I also managed to sync slicers between multiple pages so that when the owner wants to check a specific category and it's data in the remaining report pages, he'll just switch pages and can find the required selection.
- Finally, I also created a Q&A chart and put multiple synonyms so it would be easy for the owner to ask about anything he wants, and I edited the interactions of the slicer so that it won't affect the answers he's expecting to the required question.
At the end, I managed to create the visualizations in an organized and simple way & used contrasting and matching colors.


