DTMF using Matlab
تفاصيل العمل
Write a Matlab function x = sym2TT(S) that generates a 100 milliseconds time-domain signal
corresponding to a given DTMF symbol S. The set of all DTMF symbols and their corresponding
frequencies are indicated in Figure 1.
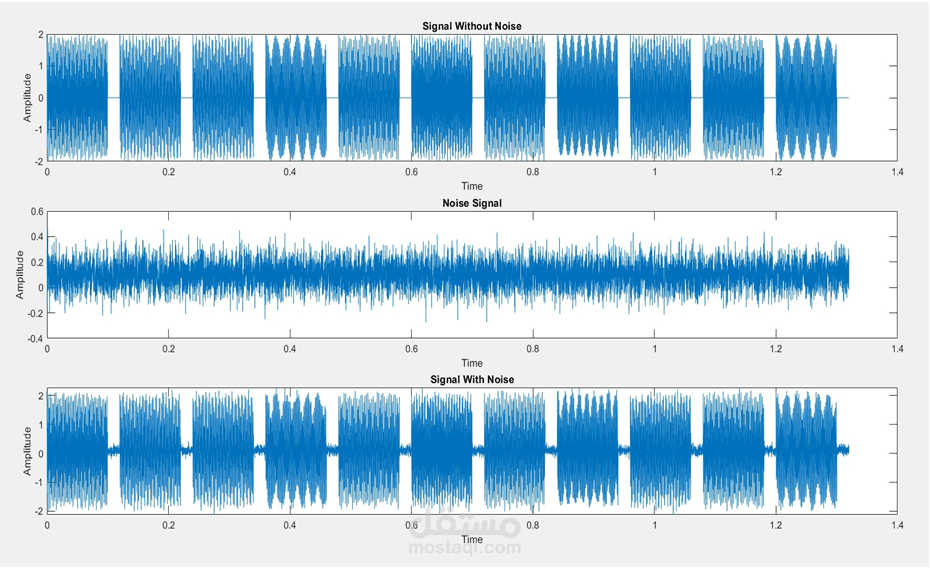
2. Generate a signal xptq which contain a sequence of DTMF symbols corresponding to your cell
phone number. Add a 20 milliseconds guard interval between consecutive DTMF symbols.
3 Create a signal yptq which is the signal xptq contaminated with additive white Gaussian noise
with variance 0.1.
4. Store the generated signal yptq as an audio file with extension (*.wav)
5) Plot the signal yptq. Note that, this plot does not provide any frequency-domain information
about yptq.
6) Use the FFT command to obtain the spectrum Y pfq of the signal yptq, hence plot the magnitude spectrum (in dB) in the frequency range 600Hz ď f ď 1700Hz. Note that, this plot does not
provide any time-domain information about yptq.
7. Write your own Matlab code to create a set of spectrograms of the signal yptq using the following
parameters:
• Overlap between the sliding windows:
• FFT size: 214, this is the total number of samples in time-domain and in frequency-domain as
well.
• Time-domain window size: use the following values t16, 64, 256, 1024, 4096u.
Create a spectrogram for each window size (t16, 64, 256, 1024, 4096u) using a rectangular
time-domain window.
• Change the time-domain window to a blackman window and create a spectrogram for each
window size (t16, 64, 256, 1024, 4096u). For a given window size, which window type (rectangular
or blackman) provides a better frequency resolution ?
Do your research on how to use the Matlab function “goertzel” to decode DTMF symbols.
Matlab code to decode the signal