Bike Share System Analysis using Python
تفاصيل العمل
In this project, I explored data related to bike-share systems for three major cities in the
United States. Chicago, New York City, and Washington. In an interactive and friendly
experience, the user chooses to filter the data by city first, then he has the freedom to
specify a certain month or a certain day to add as a filter. by computing some descriptive
statistics. The user gets some interesting information that is readable, understandable, and
easy to follow as below:
• most common month
• most common day of the week
• most common hour of the day
• most common start station
• most common end station
• most common trip from start to end (i.e., most frequent combination of start station
and end station)
• total travel time
• average travel time
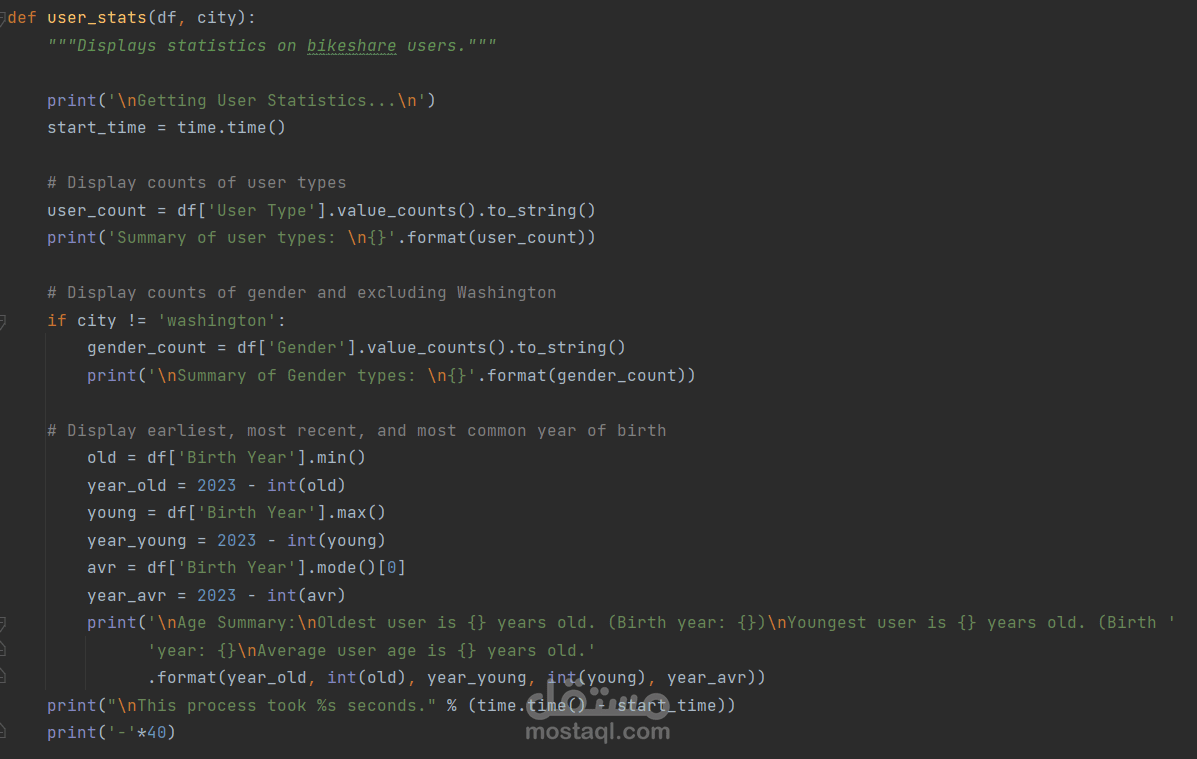
• counts of each user type
• counts of each gender (only available for NYC and Chicago)
• the ages and years of birth for the youngest, oldest, and the average user
in the end, the user is prompted if he wants to take a look at the data as they are filtered.
He also gets to choose how many rows to view.
Bike Share Data:
Over the past decade, bicycle-sharing systems have grown in number and popularity in cities.
worldwide. Bicycle-sharing systems allow users to rent bicycles on a very short-term basis.
for a price. This allows people to borrow a bike from point A and return it at point B,
though they can also return it to the same location if they'd like to just go for a ride.
Regardless, each bike can serve several users per day.
Thanks to the rise in information technologies, it is easy for a user of the system
to access a dock within the system to unlock or return bicycles. These technologies
also provide a wealth of data that can be used to explore how these bike-sharing systems
are used.
data was provided by “Motivate”, a bike share system provider for many major cities in the
United States.